- Monitoring, Alerts, and Reporting
- Overview Dashboard
- Creating Dashboard Widgets
- Reports
- Chargeback
- Optimization
- Alerts
- Assigning the Notifier Role
- Creating an Alert
- Creating a Hardware Reconfigured Alert
- Creating a Normal Operating Range Alert
- Creating a Real Time Performance Alert
- Creating an Hourly Performance Alert
- Creating a hostd Log Threshold Alert
- Creating a VMware Alarm Alert
- Creating an Expression Alert
- Create an Operational Alert
- Operational Alert Types
- Editing an Alert
- Copying an Alert
- Deleting an Alert
- Evaluating an Alert
- Alert Profiles
- Importing and Exporting
- OpenShift Prometheus Alerts
- Regular Expressions
- Reportable Fields in ManageIQ
Monitoring, Alerts, and Reporting
Overview Dashboard
Overview shows your virtual environment’s events, reports, and configurable alerts. This information supports better information technology decision making and predictions for future virtual machine management.
When you log in to the console, it brings you directly to the Overview Dashboard page by default. The console uses widgets to organize this page, providing you with a default set of commonly used widgets. The configuration items on these widgets are clickable, allowing you to drill down directly to a referenced item.
Customize this page to include charts and reports you specifically want to see as soon as you log in to the console. You can add, remove, move, minimize, zoom into, and maximize widgets. Only users with the proper access can create widgets.
Adding a Widget
You can add widgets to the dashboard to accommodate the information you want to see upon login.
-
Navigate to Overview > Dashboard.
-
Click
 (Add a Widget).
 -
Select the widget you want to add from the list.
Note:
Only widgets that are not currently showing on the dashboard will appear in this list.
Resetting to the Default Set of Widgets
You can reset to default set of widgets according to your needs with the following steps:
-
Navigate to Overview > Dashboard.
-
Click
 (Reset Dashboard Widgets to the
defaults).
(Reset Dashboard Widgets to the
defaults).
Removing a Widget
You can remove a widget when you no longer need the widget to be displayed in the dashboard.
-
Navigate to Overview > Dashboard.
-
From the widget that you want to remove, click
 (Remove from Dashboard) in the upper
right corner of the widget.
(Remove from Dashboard) in the upper
right corner of the widget. -
Click OK.
The widget is removed from the dashboard, but it is not deleted. It can be added again if needed.
Zooming in to a Chart Widget
-
Navigate to Overview > Dashboard.
-
From the chart widget that you want to enlarge, click
 (Zoom in) in the upper right corner of
the widget.
(Zoom in) in the upper right corner of
the widget.
The enlarged chart is opened in its own pop-up window. To close this
window, click  (Close) in the upper right
corner.
(Close) in the upper right
corner.
Opening a Chart or Report Widget in Full Screen View
-
Navigate to Overview > Dashboard.
-
From the chart or report widget that you want to enlarge, click
 (Full Screen view)
in the upper right corner of the widget.
(Full Screen view)
in the upper right corner of the widget. -
Click OK.
Minimizing or Maximizing a Widget
-
Navigate to Overview > Dashboard.
-
From the chart or report widget that you want to maximize, click
 (Minimize) or
 (Full Screen) in the upper right
corner of the widget.
(Full Screen) in the upper right
corner of the widget.
Downloading a Report Widget as a File
-
Navigate to Overview > Dashboard.
-
From the chart or report widget that you want to download as a PDF, click
 [(Download PDF) in the upper
right corner of the widget.
[(Download PDF) in the upper
right corner of the widget. -
Click OK.
Creating Dashboard Widgets
Creating a Report Widget
-
Navigate to Overview > Reports.
-
Click on the Dashboard Widgets accordion, then choose the Reports folder.
-
Click
 (Configuration), then click
 (Add a new Widget).
 -
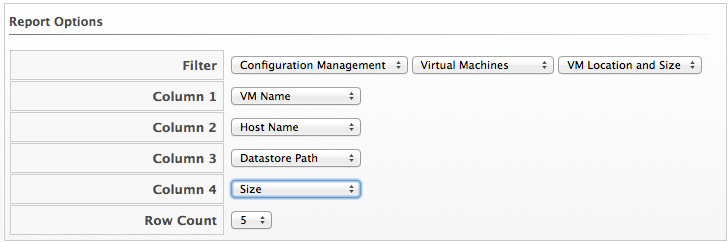
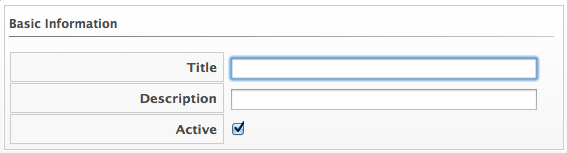
In the Basic Information area, type in a Title and Description. By default the widget will be active as soon as you create it. To make it inactive, uncheck the Active box.

-
From the Report Options area, select the filters until you are at the report you want for this widget. Select up to four columns from that report. Finally, for Row Count, select the number of rows that you want displayed.
-
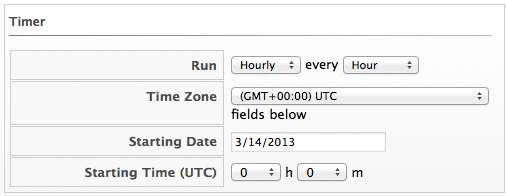
In the Timer area, click the Run drop down to specify how often you want the widget data to get updated. The options displayed will depend on which Run option you choose. Select Hourly, Daily, Weekly, or Monthly.
-
Select a Time Zone. Type or select a date to begin the schedule in Starting Date. Select a Starting Time based on a 24 hour clock in the selected time zone.
Note:
If you change the time zone, you will need to reset the starting date and time.
-
In the Visibility area, select <To All Users>, so that all users can use this widget no matter what user role they are assigned. Select <By Role> to assign this widget to specific user roles. Select <By Group> to assign this widget to specific groups.
-
Click Add.
Creating a Chart Widget
-
Navigate to Overview > Reports.
-
Click the Dashboard Widgets accordion and click the Charts folder.
-
Click
(Configuration), then click
(Add a new Widget). -
In the Basic Information area, type in a Title and Description. By default the widget will be active as soon as you create it. To make it inactive, uncheck the Active box.
-
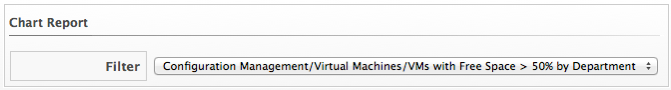
From the Chart Report area, select a chart to display in the widget.
-
In the Timer area, click the Run drop down to specify how often you want the widget data to get updated. The options displayed will depend on which Run option you choose. Select Hourly, Daily, Weekly, or Monthly.

-
Select a Time Zone. Type or select a date to begin the schedule in Starting Date. Select a Starting Time based on a 24 hour clock in the selected time zone.
Note:
If you change the time zone, you will need to reset the starting date and time.
-
In the Visibility area, select <To All Users>, so that all users can use this widget no matter what user role they are assigned. Select <By Role> to assign this widget to specific user roles. Select <By Group> to assign this widget to specific groups.
-
Click Add.
Creating a Menu Widget
-
Navigate to Overview > Reports.
-
Click the Dashboard Widgets accordion and click the Menus folder.
-
Click
(Configuration), then click
(Add a new Widget). -
In the Basic Information area, type in a Title and Description. By default the widget will be active as soon as you create it. To make it inactive, uncheck the Active box.
-
In the Menu Shortcuts area, use the Add a Shortcut dropdown to select all the places in the console that you want to add to this widget.
-
In the Visibility area, select <To All Users>, so that all users can use this widget no matter what user role they are assigned. Select <By Role> to assign this widget to specific user roles. Select <By Group> to assign this widget to specific groups.
-
Click Add.
Editing a Widget
-
Navigate to Overview > Reports.
-
Click the Dashboard Widgets accordion and select the widget you want to edit.
-
Click
(Configuration), and then
 (Edit this Widget).
 -
Make the required changes.
-
Click Save.
Copying a Widget
-
Navigate to Overview > Reports.
-
Click the Dashboard Widget accordion, and select the widget you want to copy.
-
Click
(Configuration), and then
 (Copy this Widget).
 -
Type a unique name for the widget and edit its properties.
-
Click Save.
Deleting a Widget
Note:
Default widgets cannot be deleted, but they can be copied.
-
Navigate to Overview > Reports.
-
Click the Dashboard Widget accordion and select the widget you want to delete.
-
Click
(Configuration), and then  (Delete this Widget from the Database).
 -
Click OK.
Importing a Widget
You can share widgets between appliances using the export and import features.
-
Navigate to Overview > Reports.
-
In the Import/Export accordion, click Widgets.
-
In the Import area, click Browse to select an import file.
-
Click Upload.
Exporting a Widget
You can share widgets between appliances using the export and import features.
-
Navigate to Overview > Reports.
-
In the Import/Export accordion, click Widgets.
-
In the Export area, select the widgets that you want to export.
-
Click Export.
Generating Widget Content Immediately
-
Navigate to Overview > Reports.
-
Click the Dashboard Widgets accordion and select the widget you want to generate.
-
Click
(Configuration), and then
(Generate Widget Content now). -
Click OK.
The content is generated immediately instead of waiting for the next scheduled update. Generation of widget content is shown under Tasks, accessed from the settings menu.
Reports
Click the Reports accordion under Overview > Reports to see a list of reports available. These reports have been constructed to help you view the most commonly requested and significant data. From here, you can also create reports if you have appropriate access. ManageIQ provides a large group of default reports organized into categories. Each category has its own set of subfolders.
-
Configuration Management: hardware, application, network, service, user account, operating system, and snapshot information for all of your items.
-
Migration Readiness: information related to items required to migrate a virtual machine.
-
Operations: free space on registered and unregistered virtual machines, power states for virtual machines, and SmartState analysis status.
This category also provides reports relating to the operation of ManageIQ, such as user IDs and snapshots taken by ManageIQ.
-
VM Sprawl: usage information and disk waste.
-
Relationships: virtual machine, folder, and cluster relationships.
-
Events: operations and configuration management events.
-
Performance by Asset Type: performance of your virtual infrastructure.
You must be capturing capacity and utilization data to get this information.
-
Running Processes: information on processes running on a virtual machine.
You must have domain credentials entered for the zone to collect the information for these reports, and the virtual machine must have been analyzed at least once.
-
Trending: projections of datastore capacity, along with host CPU and memory use.
-
Tenants: quotas report aggregated by each tenant that shows quota name, total quota, in use, allocated, and available. The report currently lists all tenants and there is no nesting information available by parent and child tenants.
-
Provisioning: provisioning activity based on the approver, datastore, requester, and virtual machine.
For a complete list of reportable fields in ManageIQ, see Reportable Fields.
Running Reports
There are two different ways to generate a report: by scheduling the report, or running the report manually by clicking the report generation button on the Reports page. ManageIQ uses interactive report generation so that reports are placed on a queue. A visual indicator of the reports status is shown. All reports are automatically saved so that they can be downloaded and analyzed later.
Generating a Single Report
-
Navigate to Overview > Reports.
-
Click the Reports > All Reports accordion. Navigate to the report you want to view by selecting the appropriate folder.
-
Click
(Queue). -
The report generation is placed on the queue and its status shows in the reports page.

-
Click
 (Reload current display) to
update the status.
(Reload current display) to
update the status. -
When a report has finished generating, click on its row to view it.
Scheduling a Report
You can view historical data by creating reports on a scheduled basis. In addition, scheduled reports can be emailed directly to users.
Note:
You may need to disable, change the report filter, or change the frequency of a schedule. To do this, you will need to edit the schedule.
There are two ways to schedule a report:
Add a new Schedule through the Reports accordion:
-
Navigate to Overview > Reports.
-
Select a report from the Reports accordion and click
Configuration. -
Click
Add a New Schedule or click the Schedules accordion and click
Configuration > Add a New Schedule.
or
Add a new Schedule through the Schedules accordion:
-
Navigate to Overview > Reports.
-
Click the Schedules accordion.
-
Click
Configuration. -
Click
Add a New Schedule.
Adding new Schedule details.
-
In the Basic Information area, type in a Name and Description for the schedule.
- By default, Active is checked to enable the scan.
-
The Report Selection area is pre-populated if you added the schedule directly from the report. If you are adding from the schedule according, use the Filter drop downs to select the report that you want to schedule.
-
In the Timer area, click the Run drop down to specify how often you want the analysis to run. Your options after that will depend on which run option you choose.
-
Click Once to have the analysis run just one time.
-
Click Daily to run the analysis on a daily basis. You will be prompted to select how many days you want between each analysis.
-
Click Hourly to run the analysis hourly. You will be prompted to select how many hours you want between each analysis.
-
Type or select a date to begin the schedule in Starting Date.
-
Select a Starting Time based on a 24 hour clock in the ManageIQ appliance’s Time Zone.
-
-
Use the E-Mail after Running feature to send an email after the report has been generated to selected users. The email will include a link to the report.
-
Check Send an E-mail.
-
In From (leave blank for default), type in the sending email.
-
Use Add a User, to select a specific user. The user must have a valid email address entered under accounts.
-
Use Add (enter manually) to type in the address not registered to a User.
-
Then, click
(Add).
-
-
If you are sending an email after the report runs, then you can select further options under Email Options.
-
Check Send if Report is Empty if you want an email even if no records exist in the report.
-
Next to Attachments, check if you would like the report attached as a Text, CSV, or PDF file.
-
-
Click Add.
Note:
See Outgoing SMTP Email Settings in the General Configuration guide, to learn how to verify the address and validate outgoing email settings.
Modifying a Report Schedule
-
Navigate to Overview > Reports
-
Click the Schedules accordion and select the schedule you want to edit.
-
Click
(Configuration), then click
(Edit this Schedule). -
Make the required changes.
-
Click Save.
Running a Scheduled Report Immediately
-
Navigate to Overview > Reports.
-
Click the Schedules accordion and select the schedule you want to run.
-
Click
(Configuration), then click
(Queue up this Schedule to run now).
Viewing Reports
Once you have run a report, you can view it at any time after the first scheduled time has occurred.
-
Navigate to Overview > Reports.
-
Click the Saved Reports accordion or the Reports accordion.
-
Click on the instance of the report you want to view.
Changing Report Views
After running a report, you can customize your view in several ways.
Some reports can be viewed as charts as well as lists. This will depend on the type of data and on how the report has been created. Where applicable, you will see these additional buttons:
-
Navigate to Overview > Reports.
-
Click a completed report to view. Click one of the following buttons for the view you want:
-
Click
 for Graph View.
 -
Click
 for Hybrid
View.
for Hybrid
View. -
Click
 for Tabular
View.
for Tabular
View.
-
Filtering Report Data
To filter the report information you see, use the  Data View button.
-
Navigate to Overview > Reports.
-
Click a completed report to view.
-
Click the
button for Data
View, which opens the search field. -
Select the criteria from the dropdown menu to filter by, and enter your search term.
-
Press Enter to search.
Sorting Reports by Column
In tabular and hybrid view, you can sort a list of
reports by column.
-
Navigate to Overview > Reports > Saved Reports.
-
Click a report name to show a list of completed reports.
-
Click any blue column heading to sort the reports by the values in that column.
Downloading a Report
Download reports to analyze the data using other tools or to print the report.
When you click on one of the supplied reports, you are presented with a group of buttons to download the report in one of three formats or to view the report in a full screen.
-
Navigate to Overview > Reports.
-
Click the report you want to view.
-
Click on the row for the instance of the report you want to download. If the report needs to be generated, see Running Reports.
-
Click on the report download buttons for the type of export you want.
-
Click
 (Download this
report in text format) to download as text.
(Download this
report in text format) to download as text. -
Click
(Download this
report in csv format) to download as a comma-separated file. -
Click
(Download this report in PDF
format) to download as PDF. -
The report is automatically named with the type of report and date.
-
Note:
Edit and delete buttons are only visible to administrators and super administrators. Edit and delete functions are only available to customer-created reports. The ManageIQ pre-configured reports cannot be edited or deleted, but they can be copied.
Showing a Report in Full Screen
View the report in full screen to examine report details. From full screen, you can also print the chart that accompanies a report.
-
Navigate to Overview > Reports.
-
Click the Reports > All Reports accordion and select the report that you want to view.
-
Click the Saved Reports tab and select a report.
-
On the Saved Report detail screen, click
(Configuration), and click
 (Show full screen Report).
The report will appear in full screen view. Click back on your browser to return to the reports explorer.
Adding a Report
Add reports if the default reports do not include what you need or you want to narrow the scope of a report. For example, you may want a report that shows only Windows virtual machines.
-
Navigate to Overview > Reports.
-
Click the Reports > All Reports accordion.
-
Click
(Configuration), then click
(Add a New Report). -
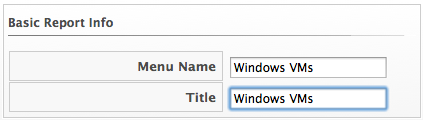
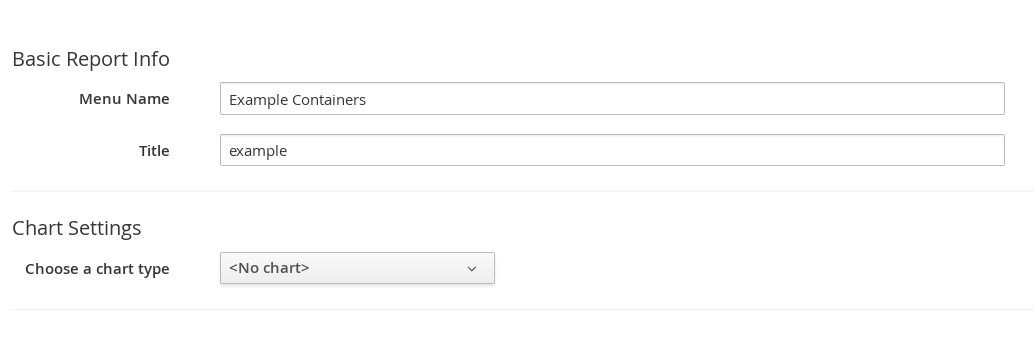
In the Columns tab, edit the Basic Report Info area.
-
Type a unique name in Menu Name for how you want the report described in the menu list.
-
Type the Title you want displayed on the report in title.
-
-
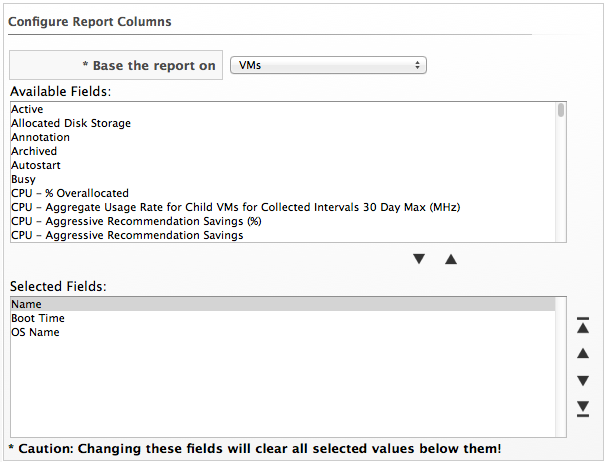
Add fields in the Configure Report Columns area.
-
Use the Base the report on table dropdown to choose a table to get fields from.
Note:
If you change the report base or the interval, all selections below will be reset.
-
Select fields that you want in the report from Available Fields, and then click

(Move selected fields down). In addition to the fields, you can also select any tags that you have created and assigned. -
Change the order of the fields in the report by clicking

(Move selected fields up)or (Move selected fields down).
-
-
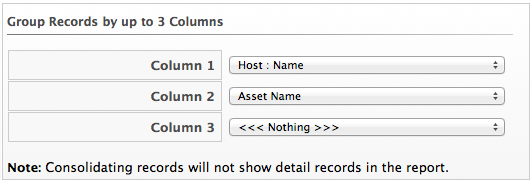
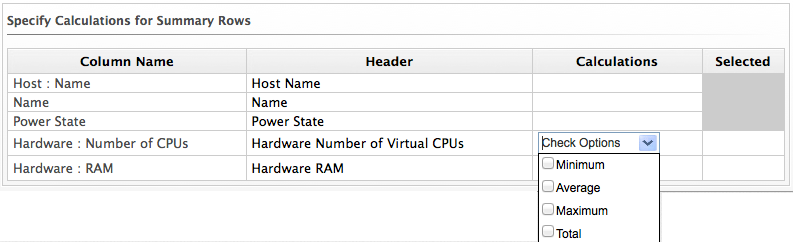
Click on the Consolidation tab to consolidate and aggregate data points into maximum, minimum, average, and total. Specifically, this would be useful for analyzing performance data over a specific period of time.
Note:
Please note that if you do this, you will not see individual records, but rather the calculation as a column header.
-
Select the columns to group by.
-
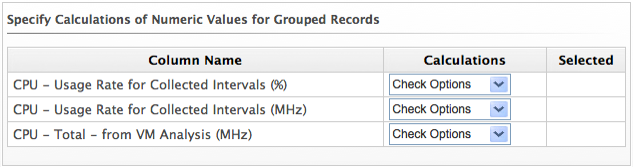
For each numeric field selected in the report, you can click the dropdown under Calculations. Check the calculations you want to use.
-
-
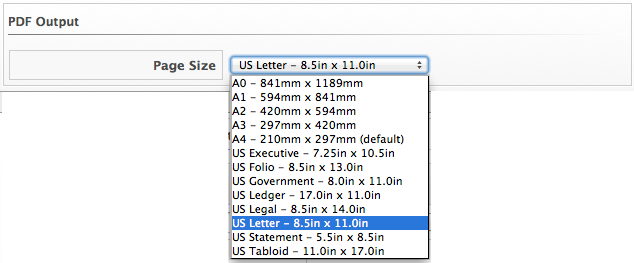
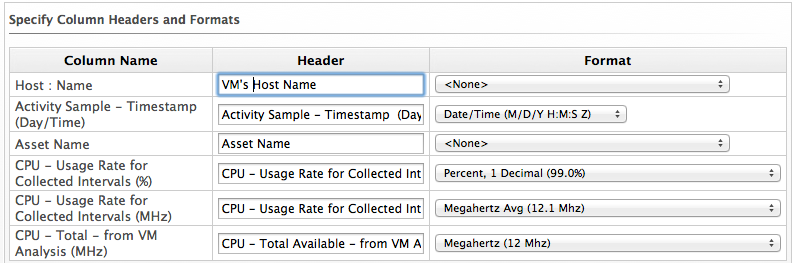
Click on the Formatting tab to set the size of paper for a PDF and column header format.
-
From the PDF Output area, select the page size from the dropdown.
-
From Specify Column Headers and Formats, type the text you want displayed for each field. For each numeric field, you can also set the numeric format.
-
-
Click on the Styling tab to change the color of the text or the background for a row based on a condition.
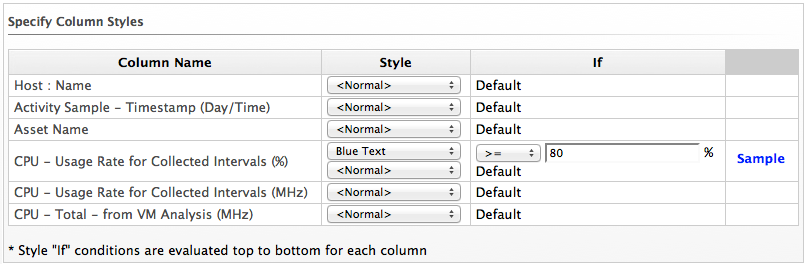
-
Use Style to select the format for the value. You can choose to change the text color or the background.
-
Use If to create a conditional statement for the style.
-
-
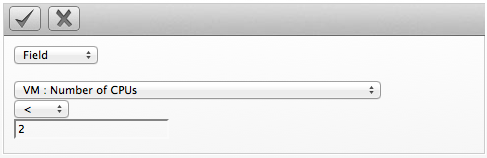
Click on the Filter tab to set filters for the data displayed in the report. There are two types of filters: the first is the Record Filter which is the primary filter of the main tables records, the second is also a Display Filter, which is a secondary filter of rows based on the fields of the child table. Click
in the appropriate area to use the
expression editor to choose the appropriate options for your
criteria. Based on what you choose, different options will show.-
Click Field to create criteria based on field values.
-
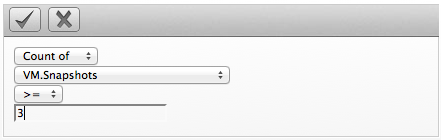
Click Count of to create criteria based on the count of something, such as the number of snapshots for a virtual machine, or the number of virtual machines on a host.
-
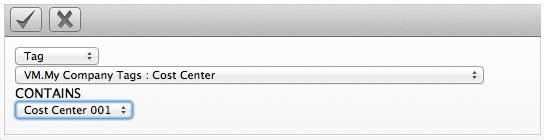
Click Tag to create criteria based on tags assigned to your resources. For example, you may want to check the power state of a virtual machine or see if it is tagged as production.
-
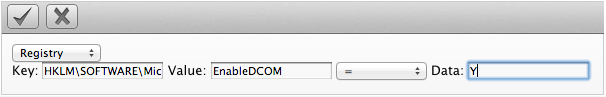
Click Registry to create criteria based on registry values. For example, you may want to check if DCOM is enabled on a Windows system. (Note that this applies only to Windows operating systems.)
-
Click Find to seek a particular value, and then check a property. For example, finding the
Adminaccount and checking that it is enabled.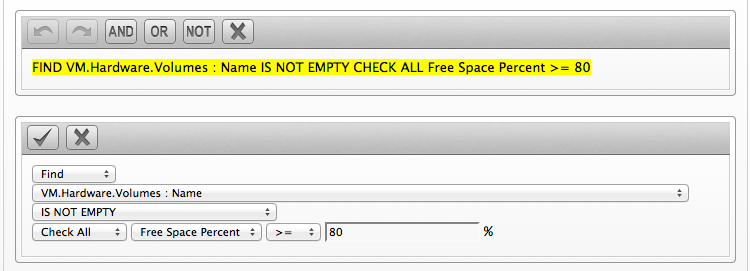
-
Click

(Commit Expression Element
Changes)
to add the expression.Note:
The filters that you apply will show at the bottom of the report so that you know which filters have been applied.
-
-
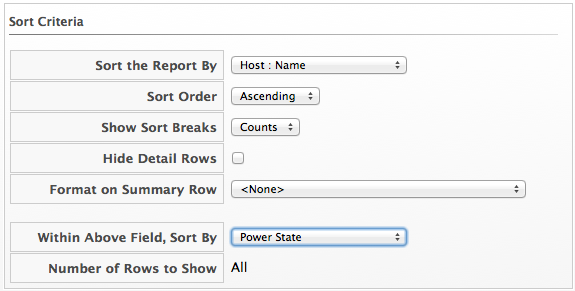
Click on the Summary tab to select sort order, sort type, groupings, and group calculations for the report. Summary groups rows of data based on the sort breaks. You can only sort by fields that display in the report.
-
Set the primary sort in Sort the Report by.
-
Set the next sorts in Within Above Field, Sort By.
-
Select the type of sort, ascending or descending, in Sort order.
-
In Show Sort breaks, select Yes to show the sort breaks, Counts to show sort breaks with the count, or No for no sort breaks.
-
For any numeric field, you can select to show minimum, average, maximum, and total in the sort break.
-
-
Click on the Charts tab to create a chart for the report. This is not required.
-
Use Choose a chart type to select a type of chart. Note that some charts may not produce the result you are looking for based on the types of fields in the report and its sort order.
-
If you only want to see the top values, select the number of top values from Top values to show.
-
If you want to see the total number of values that are not categorized or evaluated against others, check Sum ‘Other’ values.
-
-
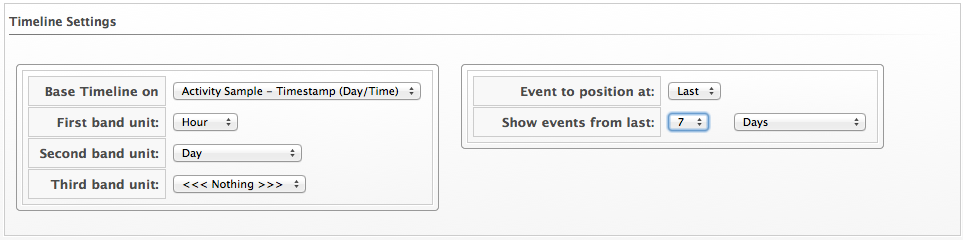
Click on the Timeline tab to select a timeline for the report. You must have a field of time or date format to use this feature.
-
Use Base Timeline on to select a column in date or time format for the report.
-
Select a unit of time for the first band in First band unit.
-
Select a unit of time for the second band in Second band unit.
-
Select a unit of time for the third band in Third band unit.
-
Select an Event to position at.
-
Select the range for the event to position from Show events from last.
-
-
Click the Previews tab to see a sample of your report.
-
When you have the report that you want, click Add to create the new report.
Note:
After the new report is created, to make the report accessible from the report menu, you must add it to a report menu.
Copying a Report
Use this feature to copy a report that is similar to one that you want to create. By copying a report, you only need to make minor edits instead of creating an entirely new report.
-
Navigate to Overview > Reports.
-
Click the Reports > All Reports accordion and select the report that you want to copy.
-
Click
(Configuration), then click
(Copy this report). -
On the Columns tab, edit the Basic Report Info area to include a new Menu Name. Each Menu Name must be unique.
-
Make any other changes you need. See “Adding a Report” for details on the changes you can make.
-
Click Add.
Editing a Report
If you find that a report is not giving you the data that you need, you can edit it after it has been created. Note that only reports that you have created can be modified. Only administrators and super administrators of ManageIQ can add, copy, edit, and delete reports.
-
Navigate to Overview > Reports.
-
Click the Reports > All Reports accordion and select the report you want to edit.
-
Click
(Configuration),
(Edit this Report). -
Make any changes you need.
-
Click Save.
Deleting a Report
Delete reports when you find that they are no longer useful. Only administrators and super administrators of ManageIQ can add, copy, edit, and delete reports.
Note:
Please note that only customer-created reports can be deleted.
-
Navigate to Overview > Reports.
-
Click the Reports > All Reports accordion and select the report you want to delete.
-
Click
(Configuration),
(Delete this Report from the
Database).Note:
The Delete this report from the Database option will only appear on reports you have created. Default reports cannot be deleted.
-
Click OK.
Importing a Report
Reports are stored in the VMDB; however, you can share customized reports among VMDBs. To do this use the export and import feature of reports.
-
Navigate to Overview > Reports.
-
Select Custom Reports from the Import/Export accordion.
-
In the Import area, click Browse to select an import file.
-
To overwrite an existing report with the same menu name, select Overwrite existing reports.
-
Click Upload to import the report to the Company-Custom folder.
Exporting a Report
Reports are stored in the VMDB. Custom reports may be shared among VMDBs. Share your custom reports using the export and import features.
-
Navigate to Overview > Reports.
-
Select Custom Reports from the Import/Export accordion.
-
In the Export area, select the reports to export.
-
Click Export.
Managing Report Menus
By default, all account roles have the same reports available. If you have the super administrator or administrator role, you can customize the accordions, the folders within them, and the locations of your reports.
Note:
When you create your own report, the report is not automatically available. You must add it to a report menu.
The report menu is a hierarchical structure that consists of the following components:
-
The top level, under which the accordions are shown. (Top level is only displayed when you are in the report menu editor.)
-
Accordions that are general categories for the reports. The defaults supplied are Configuration Management, Migration Readiness, Operations, VM Sprawl, Relationships, Events, Performance by Asset Type, Trending, Tenants, Provisioning, and Running Processes.
-
Folders that are used to further organize reports within an accordion. For example, under the Configuration Management, there are folders for virtual machines, hosts, and other virtual infrastructure components.
-
Reports that are stored directly in the folders.
Managing Report Menu Accordions
-
Navigate to Overview > Reports.
-
Click the Edit Report Menus folder.
-
Click the role whose menus you want to customize.
-
Click on Top Level to organize, add, and delete folders.
-
Click
 (Move selected
folder to top) to move the folder to the top of the list.
(Move selected
folder to top) to move the folder to the top of the list. -
Click
 (Move selected folder
up) to move the folder up.
(Move selected folder
up) to move the folder up. -
Click
 (Move selected folder
down) to move the folder down.
(Move selected folder
down) to move the folder down. -
Click
 (Move selected
folder to bottom) to move the folder to the bottom of the
list.
(Move selected
folder to bottom) to move the folder to the bottom of the
list. -
Click
 (Delete selected folder
and its contents) to delete a folder.
(Delete selected folder
and its contents) to delete a folder. -
Click
 (Add folder to selected
folder) to add an folder.
(Add folder to selected
folder) to add an folder.Note:
If you are creating a new folder, Top Level must be selected under Reports. Be sure to select the folder you want to create a subfolder for on the left pane. To name the folder, double-click on New Folder, then click on Top Level in the Reports area.
-
-
When you are finished adding folders, click Commit. To revert, click Discard.
-
Click Save.
The new folder is added, and you can add folders in which to store reports to it. You can also organize the reports into folder that are meaningful to you.
Managing Report Menu Folders
-
Log in to the console as a user who is assigned either the super administrator or administrator account role.
-
Navigate to Overview > Reports.
-
Click the Edit Report Menus accordion.
-
Click the role whose menus you want to customize.
-
Click on the accordion name you want to organize or add folders to.
-
Click
(Move selected
folder to top) to move the folder to the top of the list. -
Click
(Move selected folder
up) to move the folder up. -
Click
(Move selected folder
down) to move the folder down. -
Click
(Move selected
folder to bottom) to move the folder to the bottom of the
list. -
Click
(Delete selected folder
and its contents) to delete an folder. -
Click
(Add subfolder to selected
folder) to add a folder. When creating a subfolder, be sure to
select the folder that you want the subfolder to show under. To
name the folder, double-click on New Folder.
-
-
When you are finished making changes click Commit. To revert, click Discard.
-
Click Save.
Note:
Only reports that are not already in another folder can be assigned.
Organizing Reports in Report Menus
-
Log in to the console as a user who is assigned either the Super Administrator or Administrator Account Role.
-
Navigate to Overview > Reports.
-
Click the Edit Report Menus accordion.
-
Click the role whose menus you want to customize.
-
Expand the Report accordion and menus using the triangles to the left of the item name until you are able to select the subfolder where you want to put reports.
-
Choose one of the following actions:
-
To add a report, select a report from the Available Reports area on the right and click
 (Move selected reports left).
 -
To remove a report from a folder, select the report from the Selected Reports area and click
 (Move selected reports
right).
(Move selected reports
right). -
To move a report to the top of the folder, select the report and click
(Move selected
reports to top). -
To move a report up one place in the folder, select the report and click
(Move selected reports
up). -
To move a report down one place in the folder, select the report and click
(Move selected
reports down). -
To move a report to the bottom of the folder, select the report and click
(Move
selected reports to bottom).
-
-
When you are finished making changes click Commit.
-
Click Save.
The changes are made. The next time a user with this Account Role logs in, the new report and menu structure will be displayed.
Chargeback
The chargeback feature allows you to calculate monetary virtual machine charges based on owner or company tag. To use this feature you must be collecting capacity and utilization data.
Chargeback Rates
ManageIQ provides a default set of rates for calculating chargeback costs, but you can create your own set of computing and storage costs by navigating to Overview > Chargeback and clicking the Rates accordion.
You can configure chargeback rates for various resources by selecting either Compute or Storage in the Rates accordion. Compute sets chargeback rates for CPU, disk I/O, fixed compute cost, memory, and network I/O items, while Storage sets chargeback rates for fixed storage cost and disk storage.
Chargeback costs are computed using a set formula based on hourly cost per unit and hourly usage.
Chargeback can be calculated in the following currencies:
-
Australian dollar (AUD)
-
Brazilian real (BRL)
-
Swiss franc (CHF)
-
Chinese yuan renminbi (CNY)
-
Euro (EUR)
-
Pound sterling (GBP)
-
Indian rupee (INR)
-
Japanese yen (JPY)
-
South Korean won (KRW)
-
Mexican peso (MXN)
-
Norwegian krone (NOK)
-
Russian ruble (RUB)
-
Swedish krona (SEK)
-
Turkish lira (TRY)
-
United States dollar (USD)
-
South African rand (ZAR)
Chargeback rates can be assigned at a single rate or by tiers, where rates are assigned in ranges depending on level of usage.
Additionally, chargeback can be calculated at one fixed rate, or by a combination of fixed and variable rates per tier. Fixed rates are charged once per unit of time, and the variable rate is calculated by the level of usage multiplied by the number of resources used in a unit of time.
Memory Used Cost
Calculating the Memory Used Cost in dollars ($) for a day can be expressed in the following ways:
-
Memory allocation per hour (in MB) * Hourly Allocation cost per megabyte * Number of Memory Allocation metrics available for the day
-
Sum of Memory allocation for the day (in MB) * Hourly Allocation cost per megabyte
-
Sum of Memory allocation for the day (in MB) * Daily Allocation cost per megabyte / 24
Memory costs can be measured in B, KB, MB, GB, or TB.
In a scenario where 9.29 GB of memory is used in a day with the chargeback rate set at one dollar ($1) per megabyte per day, the Memory Used Cost would be $396.42.
-
9.29 GB = 9514.08 MB
-
9514.08 MB * $1 (per MB per day) = $9514.08
-
$9514.08 / 24 = $396.42 Memory Used Cost
CPU Total Cost
The CPU Total Cost is defined as the number of virtual CPUs over the selected interval (hour, day, week, month). CPU costs can be measured in units of Hz, KHz, MHz, GHz, or THz, as specified when creating a chargeback rate.
In a scenario where 16 CPUs are used in a day with the chargeback rate set at one dollar per CPU per day, the CPU Total Cost would be $16.
- 16 CPUs * $1 (per CPU per day) = $16 CPU Total Cost
CPU Used Cost
The CPU Used Cost is defined as the average CPU used in MHz over the selected rate interval (hour, day, week, month). CPU Used Cost is not supported for containers providers.
In a scenario where 2.5 GHz is used in a day with the chargeback rate set at $0.01 per MHz per day, the CPU Used Cost would be $25.
-
2.5 GHz = 2500 MHz
-
2500 MHz * $0.01 (per MHz per day) = $25 CPU Used Cost
Storage Allocated Cost
The Storage Allocated Cost is defined as the Allocated Disk Storage in bytes over the selected rate interval (hour, day, week, month). Storage costs can be measured in B, KB, MB, GB, or TB.
In a scenario where 500 GB are used in a day with the chargeback rate set at $0.10 per GB per day, the Storage Allocated Cost would be $50.
-
536,870,912,000 bytes = 500 GB
-
500 GB * $0.10 (per GB per day) = $50 Storage Allocated Cost
Storage Total Cost
The Storage Total Cost is defined as the Used Disk Storage in bytes over the selected rate interval (hour, day, week, month).
In a scenario where 250 GB are used in a day with the chargeback rate set at $0.10 per GB per day, the Storage Total Cost would be $25.
-
268,435,456,000 bytes = 250 GB
-
250 GB * $0.10 (per GB per day) = $25 Storage Total Cost
Storage Used Cost
The Storage Used Cost is defined as the Used Disk Storage in bytes over the selected rate interval (hour, day, week, month).
In a scenario where 250 GB are used in a day with the chargeback rate set at $0.10 per GB per day, the Storage Used Cost would be $25.
-
268,435,456,000 bytes = 250 GB
-
250 GB * $0.10 (per GB per day) = $25 Storage Used Cost
Note:
The following chargeback rates are not supported for containers providers:
-
Allocated CPU count
-
Used CPU
-
Used disk I/O
-
Allocated memory
Creating Chargeback Rates
ManageIQ allows you to create your own set of computing and storage costs to use for billing.
Chargeback rates can be configured at a single rate or in tiers, where one rate is assigned to one usage range, and another rate is assigned to a different usage range. You can also assign fixed and variable rates per tier if desired.
There are three methods to create a chargeback rate: editing or copying an existing rate, or creating a new rate.
Editing a Chargeback Rate
-
Navigate to Overview > Chargeback.
-
Click the Rates accordion and select an existing rate from under Compute or Storage.
-
Click
(Configuration) and
(Edit this Chargeback Rate). -
Edit the rate as desired.
-
Click Save at the bottom of the screen to save the chargeback rate.
Copying a Chargeback Rate
-
Navigate to Overview > Chargeback.
-
Click the Rates accordion and select an existing rate from under Compute or Storage.
-
Click
(Configuration) and
(Copy this Chargeback Rate). -
Edit the rate as desired.
-
Click Add at the bottom of the screen to save the chargeback rate.
Adding a Chargeback Rate
The following example shows a scenario to create a new chargeback rate for allocated CPU usage in Euro per week measured by the following tiers, calculating both fixed and variable costs:
-
Tier 1: 0-2 CPU = 1 Euro fixed + 0.5 Euro variable
-
Tier 2: 2-4 CPU = 0.8 Euro fixed + 0.4 Euro variable
-
Tier 3: 4 CPU and above = 0.6 Euro fixed + 0.2 Euro variable
To configure this rate:
-
Navigate to Overview > Chargeback.
-
Click the Rates accordion and select Compute to create a CPU chargeback rate.
- Click (Configuration) and
(Add a new Chargeback Rate).
- Click
-
Type in a Description for the chargeback rate.
-
Select Euro for currency.
-
In Rate Details, select the time, and fill in the range and rates for each tier. Alternatively, a single chargeback rate can be configured by using only one tier. For this example, in Allocated CPU Count, configure:
-
For tier 1, set:
-
In Per Time, select Hourly.
-
In Range, specify the CPU range: Start remains as
0.0and Finish is2. -
In Rate, specify
1for the Fixed rate, and0.5for the Variable rate. -
Click Add under Actions to create a new, blank Allocated CPU Count line for tier 2.
-
-
For tier 2, set:
-
In the new line in Range, specify the CPU range: Start is
2and Finish is4. -
In Rate, specify
0.8for the Fixed rate, and0.4for the Variable rate. -
Click Add under Actions to create another new, blank Allocated CPU Count line for tier 3.
-
-
For tier 3, set:
-
In the new line in Range, specify the CPU range: Start is
4and leave Finish asInfinity. -
In Rate, specify
0.6for the Fixed rate, and0.2for Variable.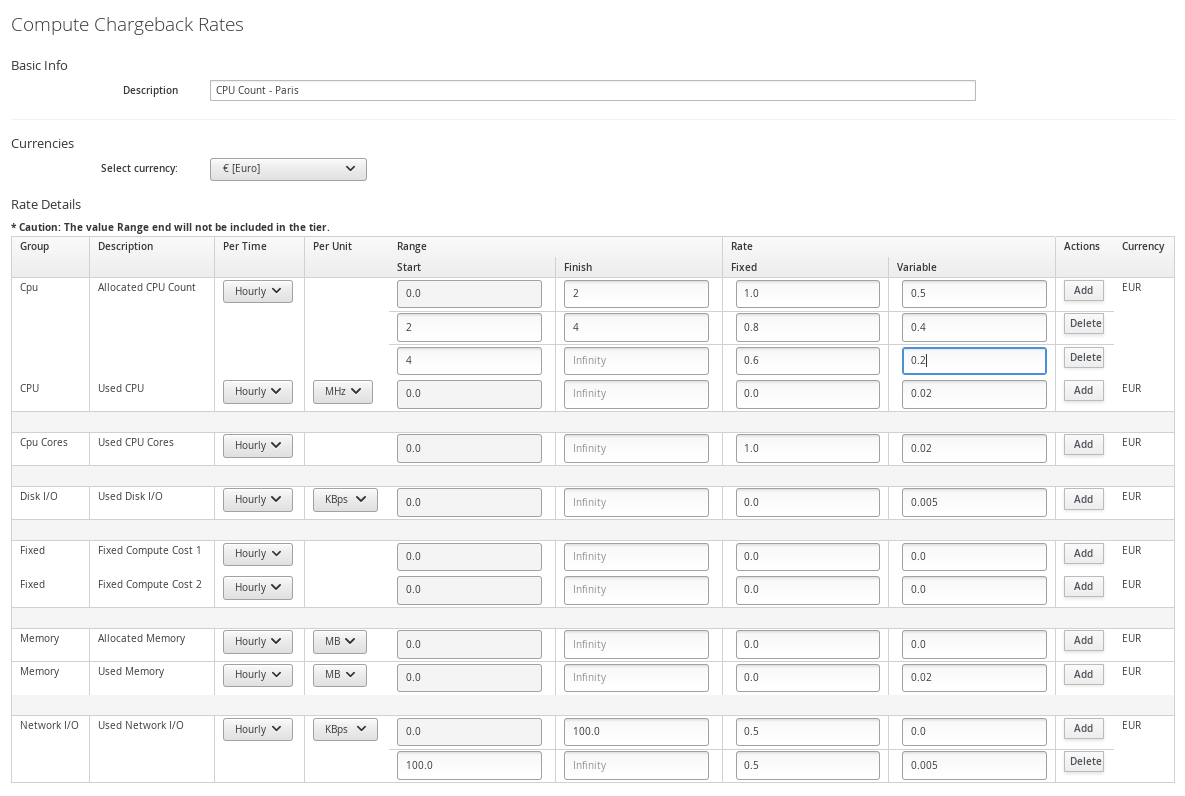
-
-
-
Click Add at the bottom of the screen to save the chargeback rate.
The rate can now be assigned.
Assigning Chargeback Rates
ManageIQ allows you to assign chargeback rates by choosing from Compute and Storage. You can assign either a custom chargeback rate, or a default rate for Compute, Storage, or Container Images.
Note:
The Default Container Image Rate can be useful when applied to a containers provider with multiple images, where only some of the images have a chargeback rate assigned; the images without a custom rate will then use the default rate.
-
Navigate to Overview > Chargeback.
-
Click the Assignments accordion, and click either Compute or Storage.
Configuring Chargeback for Compute
Use Compute to assign a compute chargeback rate. You can assign chargeback rates to The Enterprise, Selected Cloud/Infrastructure Providers, Selected Clusters/Deployment Roles, Selected Containers Providers, Tagged VMs and Instances, Tagged Images, Labeled Images, or Tenants.
-
From the Basic Info area, use the Assign To list to select a type of assignee to assign the rate set to.
-
For Tagged VMs and Instances and Tagged Images select a Tag Category.
-
For each item to set, select the chargeback rate to use. The options displayed vary based on the type you select.
-
Click Save.
Configuring Chargeback for Storage
Use Storage to assign a storage chargeback rate. You can assign chargeback rates to The Enterprise, Selected Datastores, Tagged Datastores, or Tenants.
-
From the Basic Info area, use the Assign To list to select a type of assignee to assign the rate set to.
-
For Tagged Datastores select a Tag Category.
-
For each item to set, select the chargeback rate to use. The options displayed vary based on the type you select.
-
Click Save.
The rate is assigned. The next time you generate a chargeback report, these values will be used.
Note:
When viewing chargeback, there is a rate for a virtual machine for the number of the CPUs. The chargeback for this parameter is calculated based on when the virtual machine is running. If the virtual machine is not running, then it is not charged for CPU allocation.
Creating a Chargeback Report
ManageIQ allows you to create chargeback reports to monitor costs you charged.
Note:
When creating a chargeback report, the Total Cost is the complete cost for the chosen workload over the selected time frame. Total costs are calculated by adding the calculated costs for the amount used and the amount allocated for the time frame. When adding cost related columns to display on your report, be sure to select all rate assigned fields to present a comprehensive accounting of total costs.
-
Browse to menu: Overview > Reports.
-
Click the Reports accordion.
-
Click Configuration, then click
Add a new Report. -
On the Columns tab, fill out the Basic Report Info area.
-
Type a unique name in Menu Name for how you want the report described in the menu list.
-
Type the Title to display on the report.
-
-
Add fields in the Configure Report Columns area.
-
From the Base the report on list, select Chargebacks.
-
Select the fields to include in the report from the Available Fields list, then click
Move selected fields down. In addition to the fields, you can also select any tags that you have created and assigned. -
Change the order of the fields in the report by clicking
Move selected fields up or
Move selected fields down.
-
-
Click the Formatting tab to set the size of paper for a PDF and column header format.
-
From the PDF Output area, select the page size from the Page Size list.
-
From Specify Column Headers and Formats, type the text to display for each field. For each numeric field, you can also set the numeric format.
-
-
Click the Filter tab to set filters for the data displayed in the report.
-
From Chargeback Filters, select how you want the costs to show, the tag category, the tag, and how you want the items grouped.
-
From Chargeback Interval, select the time interval. You must have a full interval worth of data in order to select an option other than Partial in the Daily Ending With list.
-
-
Click the Preview tab, and then Load to see what the report will look like.
-
When you are satisfied that you have the report that you want, click Add to create the new report.
The new report is created. To make the report accessible from the Report menu, you must add it to a report menu.
Optimization
Optimization provides administrators with a series of reports to provide meaningful information on areas for optimizing resources such as CPU, memory and disk and identify potential savings.
Running an Optimization Report
-
Navigate to Overview > Optimization.
-
Click Queue Report for each report type you choose to run.
Viewing Optimization Reports
-
Navigate to Overview > Optimization.
-
Click on the report type you wish to view details for.
-
On the report type screen, click on a report instance to view details.
-
Sort reports by clicking on the field names at the top of the report.
Alerts
Assigning the Notifier Role
-
Click
 (Configuration).
 -
Click the Settings accordion, and select the ManageIQ server.
-
From the Server Control tab, select the Notifier role.
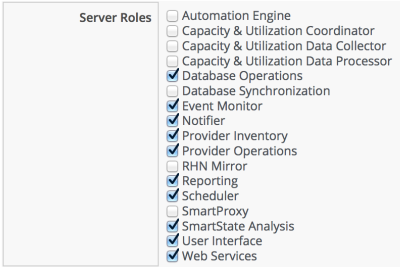
-
Click Save.
Creating an Alert
This section outlines the basic procedure to create an alert.
Note:
To send emails or SNMP traps from the ManageIQ server, you must enable the Notifier server role and set up SMTP email or SNMP traps. For more information, see General Configuration.
-
Navigate to Control > Explorer.
-
Click the Alerts accordion, then click
(Configuration), (Add a New Alert). -
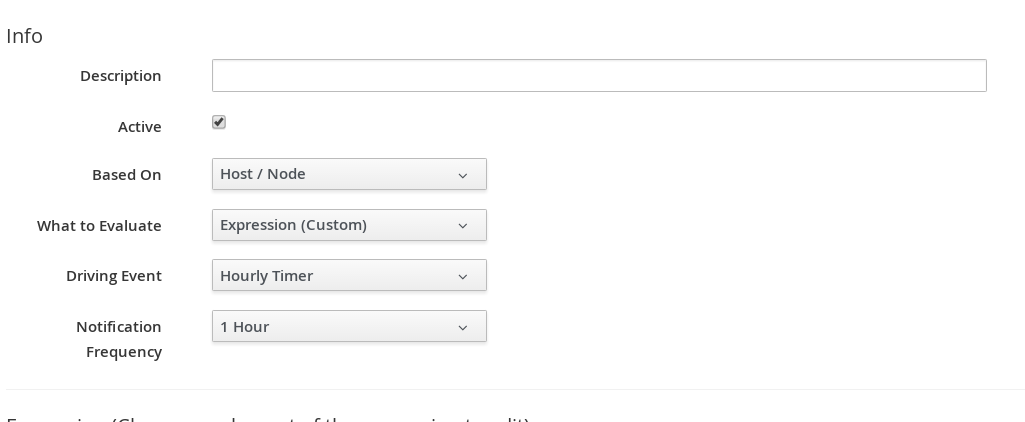
Enter the basic details of the alert:
-
Enter a description in the Description field.
-
Select the Active check box to enable the alert after creation.
-
Select the severity level from the Severity list.
-
Select the inventory item on which to base the alert from the Based On list.
-
Select the type of event that triggers the alert from the What to Evaluate list.
-
Select the frequency with which to be notified if the event log threshold is reached from the Notification Frequency list.
-
-
Configure the parameters of the alert.
Note:
The available parameters depend on the options you selected in the Based On and What to Evaluate lists. See later sections for the details of these parameters.
-
Optionally, select Send an E-mail to configure options so that an email is sent when the alert is triggered:
-
Enter the email address from which to send the email in the From field.
-
Select a user from the Add a User list to add a user registered in ManageIQ. The user must have a valid email address entered under accounts.
-
Enter the email address of a user in the Add (enter manually) field and click
to add a
user not registered in ManageIQ.
-
-
Optionally, select Send an SNMP Trap to configure options so that an SNMP trap is sent when the alert is triggered:
-
Enter the IP addresses of the hosts to send the trap in the Host fields.
-
Select the version of SNMP to use from the Version list:
-
If you select v1, enter a trap number in the Trap Number field. Enter 1, 2, or 3, based on the appropriate suffix number in the table below.
-
If you select v2, enter a trap object ID in the Trap Object ID field. Enter info, warning, or critical based on the values in the table below.
Object ID Suffix Number Added to PEN PEN with the Suffix Added info 1 1.3.6.1.4.1.33482.1 warn, warning 2 1.3.6.1.4.1.33482.2 crit, critical, error 3 1.3.6.1.4.1.33482.3
-
-
-
Optionally, select Send a Management Event to trigger an automation event:
- Enter the name of the event that exists in the Process/Event Class in the Event Name field.
-
Click Add.
Creating a Hardware Reconfigured Alert
Use a hardware reconfigure alert to detect changes to the amount of memory or the number of CPUs on a virtual machine.
-
Navigate to Control > Explorer.
-
Click the Alerts accordion, then click
(Configuration), (Add a new
Alert). -
In the Info area:
-
Type in a description for the alert.
-
From Based On, select VM and Instance.
-
From What to Evaluate, select Hardware Reconfigured.
-
In Notification Frequency, select how often you want to be notified if hardware reconfiguration is detected.
-
-
From Hardware Attribute, select Number of CPUs. From the next dropdown, select Decreased.
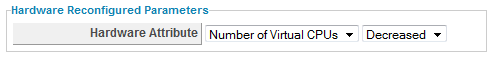
-
After setting the parameters, select what you want the alert to do. You can send an email, create an SNMP Trap, or send a management event to start an automation process.
-
Click Add.
Creating a Normal Operating Range Alert
Normal operating range alerts enables you to be notified when the normal operating range is exceeded, or falls below for a period of time from 1 minute to 2 hours. Capacity and utilization must be enabled for normal operating ranges to be calculated. See General Configuration for more information.
-
Navigate to Control > Explorer.
-
Click the Alerts accordion, then click
(Configuration), (Add a new
Alert). -
In the Info area:
-
Type in a Description for the alert.
-
From Based On, select VM and Instance.
-
For What to Evaluate, select Normal Operating Range.
-
In Notification Frequency, select how often you want to be notified if the performance threshold is reached.
-
-
Set the threshold in the Normal Operating Range Parameters area.
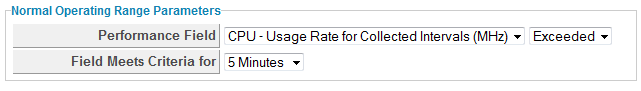
-
From Performance Field, select the field to check and whether you want to be notified if the field is exceeded or fell below.
-
In Field Meets Criteria for, select the amount of time that the threshold requires to be met to trigger the alert.
-
-
After setting the parameters, you then select what you want the alert to do. You can send an email, create an SNMP Trap, or send a management event to start an automation process. See Creating an Alert.
-
Click Add.
Creating a Real Time Performance Alert
Real Time Performance alerts enables you to be notified immediately when a performance threshold has been met for a virtual machine, host, or cluster. Capacity and Utilization must be enabled for performance thresholds to be detected.
-
Navigate to Control > Explorer.
-
Click the Alert accordion, then click
(Configuration), (Add a new
Alert). -
In the Info area:
-
Type in a Description for the alert.
-
From Based On, select VM and Instance.
-
For What to Evaluate, select Real Time Performance.
-
In Notification Frequency, select how often you want to be notified if the performance threshold is reached.
-
-
Set the threshold in the Real Time Performance Parameters area.
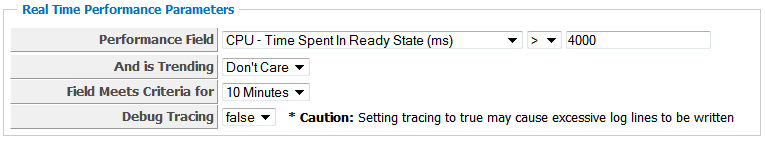
-
From Performance Field, select the field to check and any other parameters required for that field.
-
In And is Trending, select Don’t Care if it does not matter how the performance metric is trending. Otherwise, choose from the possible trending options.
-
In Field Meets Criteria for, select the amount of time that the threshold requires to be met to trigger the alert.
-
Set Debug Tracing to true only when directed to do so by Red Hat Support. This provides an extremely detailed level of logging and can result in many more log lines being written.
-
-
After setting the parameters, you then select what you want the alert to do. You can send an email, create an SNMP Trap, or send a management event to start an automation process.
-
Click Add.
Creating an Hourly Performance Alert
Hourly performance alerts enable you to be notified immediately when an hourly performance threshold has been met for a cluster. Capacity and Utilization must be enabled for performance thresholds to be detected.
-
Navigate to Control > Explorer.
-
Click the Alerts accordion.
-
Click
(Configuration),
(Add a new Alert). -
In the Info area:
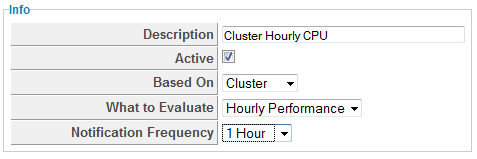
-
Type in a Description for the alert.
-
From Based On, select Cluster.
-
For What to Evaluate, select Hourly Performance.
-
In Notification Frequency, select how often you want to be notified if threshold is met.
-
-
In the Hourly Performance Parameters area select performance field and the criteria. You can also select options from the And is Trending dropdown box and whether the Debug Tracing is true or false.
-
After setting the parameters, you then select what you want the alert to do. You can send an email, create an SNMP Trap, or send a management event to start an automation process.
-
Click Add.
Creating a hostd Log Threshold Alert
Use the hostd Log Threshold to send a notification when certain items are found in the event logs for a host. A default analysis profile with event log items is required for this feature. The following example shows steps to check the host’s log for a failure to validate a virtual machine’s IP address.
-
Navigate to Control > Explorer.
-
Click the Alert accordion.
-
Click
(Configuration),
(Add a new Alert). -
In the Info area:
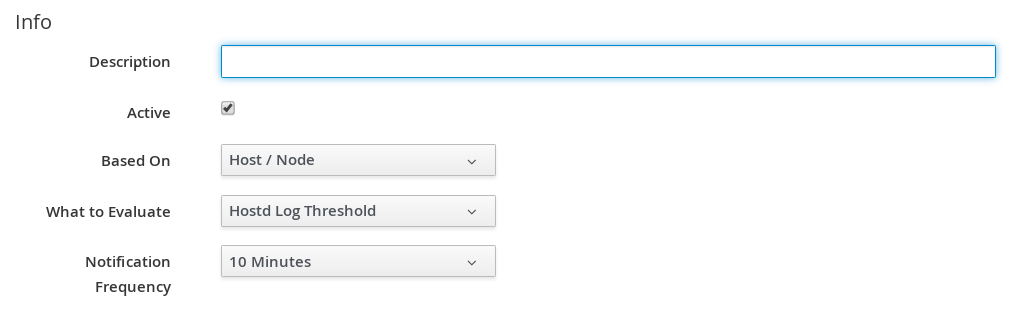
-
Type in a Description for the alert.
-
From Based On, select Host/Node.
-
For What to Evaluate, select Hostd Log Threshold.
-
In Notification Frequency, select how often you want to be notified if the log item is detected.
-
-
In the Hostd Log Threshold Parameters area, select the parameters for the event log message. You can set a threshold for a filter, level, or message source.
-
Use Message Filter to look for specific text in a message. Use Message Level to filter based on message level. ManageIQ reports on the specified level and above. Use Message Source to filter log messages based on its source.
-
Set How Far Back to Check in days you want to look for this message.
-
If you only want an alert triggered when the log message has occurred a certain number of times, type the number in Event Count Threshold.
-
-
After setting the parameters, select what you want the alert to do. You can send an email, create an SNMP Trap, or send a management event to start an automation process.
-
Click Add.
Creating a VMware Alarm Alert
ManageIQ can use VMware alarms as a trigger for an alert. This type of alert can be created for a cluster, host, or virtual machine.
-
Navigate to Control > Explorer.
-
Click the Alerts accordion, then click
(Configuration), (Add a new
Alert). -
In the Info area:
-
Type in a description for the alert.
-
From Based On, select Cluster, Host, or VM.
-
For What to Evaluate, select VMware Alarm.
-
In Notification Frequency, select how often you want to be notified if the log item is detected.
-
-
In the VMware Alarm Parameters area select the provider and alarm.
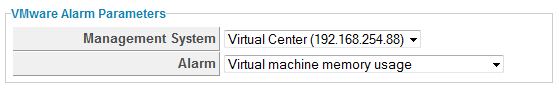
-
After setting the parameters, you then select what you want the alert to do. You can send an email, create an SNMP Trap, or send a management event to start an automation process.
-
Click Add.
Creating an Expression Alert
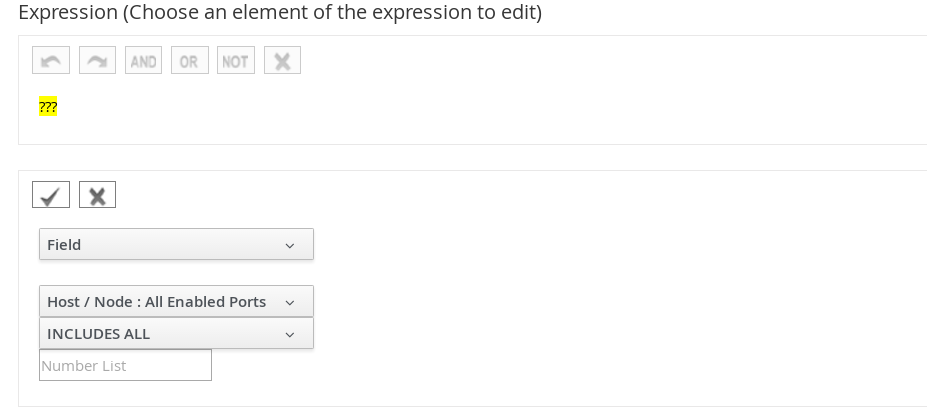
Expression alerts enables you to create a notification based on any possible criteria for clusters, datastores, hosts, and virtual machines. The following procedure creates an alert for when a host’s datastore has less than 5% free space.
-
Navigate to Control > Explorer.
-
Click on the Alerts accordion, then click
(Configuration),
(Add a new Alert). -
In the Info area:
-
Type in a description for the alert.
-
From Based On, select Host/Node.
-
For What to Evaluate, select Expression (Custom).
-
In Notification Frequency, select how often you want to be notified if the expression is evaluated to true.
-
-
Use the expression editor to create your expression. This is the same expression editor used to create Conditions.
-
Click
(Commit expression element
changes) to accept the expression. -
After setting the parameters, you then select what you want the alert to do. You can send an email, create an SNMP Trap, or send a management event to start an automation process.
-
Click Add.
Create an Operational Alert
-
Navigate to Control > Explorer.
-
Click on the Alerts accordion, then click
(Configuration),
(Add a new Alert). -
In the Info area:
-
Type in a description for the alert.
-
Check Active when you feel that the alert is ready to be enabled.
-
From Based On, select Server.
-
Select the appropriate driving event.
-
In Notification Frequency, select how often you want to be notified if the event log threshold is reached.
-
-
After setting the parameters, select what you want the alert to do. You can send an email, create an SNMP Trap, or send a management event to start an automation process.
-
Click Add.
Operational Alert Types
| Driving Event | Explanation (Thresholds, Description) | Proposed Action and Next Steps |
|---|---|---|
EVM Server Start |
Alert is raised when an server starts. |
Send e-email. This is a notification. |
EVM Server Stop |
Alert is raised when a server stops. |
Send e-mail. Review logs to see why the server stopped. |
EVM Server Not Responding |
Alert is raised when one server detects that another server has not responded in 2 minutes. |
This is a sign of a problem that should be investigated. Check logs. |
EVM Server Exceeded Memory Limit |
Alert is raised when an server has exceeded its system memory limit and begins killing workers. Default is 80%. Threshold configured in Advanced Settings. server: :worker_monitor: :kill_algorithm: :name: :used_swap_percent_gt_value :value: 80 |
This may be caused by the following issues: The server is running with too few resources. The server is enabled with too many roles or number of workers. The server picked up all the roles because another server has failed. A runaway process has taken up most of the memory. |
EVM Server is Master |
When one server takes over as a master server. |
Typically, this should only occur when first starting a set of servers, perhaps following expected outages. If a server picks up as master in other situations, the old master had an issue that needs to be researched (such as server not responding in time). |
EVM Server High System Disk Usage |
The server’s system disk is 80% full. This check is run as part of a system schedule. Threshold configured in Advanced Settings. server: events: :disk_usage_gt_percent: 80 |
Temp files used by the operating system may be filling the disk. Yum updates, normal /tmp files, or temp files in /var/lib/data/miqtemp/ may cause the problem. |
EVM Server High App Disk Usage |
The server’s app disk is 80% full. This check is run as part of a system schedule. Threshold configured in Advanced Settings. server: events: :disk_usage_gt_percent: 80 |
Server temp files may remain. |
EVM Server High Log Disk Usage |
The server’s log disk is 80% full. This check is run as part of a system schedule. Threshold configured in Advanced Settings. server: events: :disk_usage_gt_percent: 80 |
Logs are getting too big or are not being log rotated properly every day. Review the most recent logs. |
EVM Server High DB Disk Usage |
The server’s db disk is 80% full. This check is run as part of a system schedule. Applies if using PostgreSQL as the VDMB. Threshold configured in Advanced Settings. server: events: :disk_usage_gt_percent: 80 |
Database or database logging is getting too large. May require full vacuuming of PostgreSQL database. |
EVM Worker Started |
Alert is raised when a worker is about to start. |
This is a notification. Failover may trigger this alert. |
EVM Worker Stopped |
Alert is raised when a worker is requested to stop. |
Review logs for reason in the event the worker was not purposefully stopped. |
EVM Worker Killed |
Alert is raised when a non- responsive worker does not restart on its own and is killed. |
Review logs for reason the worker was killed. May be the result of EVM Worker Not Responding. |
EVM Worker Not Responding |
Alert is raised when a worker has not responded for 2 minutes (:heartbeat_timeout) or has not started within 10 minutes (:starting_timeout). |
An influx of events from the Virtual Center or Red Hat Virtualization causes an inability of EVM/CFME to handle the capacity at which they are being queued. Utilize the Event Handler Configuration to filter events that are causing problematic queue table growth. |
EVM Worker Exceeded Memory Limit |
Alert is raised when a worker exceeds the memory threshold. The default is 150 MB, but some workers have their own value in the :memory_threshold section for that specific worker. |
Review logs for reason the worker is exceeding the memory limit. This may be the result of an overload to the worker process that requires further investigation. |
EVM Worker Exceeded Uptime Limit |
Alert is raised when a worker has been running longer than the :restart_interval. (Most workers are set to never restart using the 0.hours setting.) The EMS Refresh SmartProxy workers are set to restart every 2 hours. |
Review logs for the reason the worker is exceeding the limit. This may be the result of an overload to the worker process that needs further investigation. |
EVM Worker Exit File |
Alert is raised when the scheduler worker exits due to a pending large ntp time change. |
This is a notification. |
Editing an Alert
After creating an alert, you can edit the threshold, expression, or the notification type.
-
Navigate to Control > Explorer.
-
Click on the Alerts accordion, then click on the alert that you need to edit.
-
Click
(Configuration),
(Edit this Alert). -
Make the required changes.
-
Click Save.
Copying an Alert
You can copy an existing alert to create a new alert that is similar to the existing one, then change the values associated with it.
-
Navigate to Control > Explorer.
-
Click on the Alert accordion, then click on the alert that you want to copy.
-
Click
(Configuration),
(Copy this Alert). Click OK to
confirm. -
Make the required changes.
-
Click Add.
Deleting an Alert
When an alert is no longer needed, you can remove it from your VMDB.
-
Navigate to Control > Explorer.
-
Click on the Alerts accordion, then click on the alert that you want to delete.
-
Click
(Configuration),
(Delete this Alert). -
Click OK to confirm.
Evaluating an Alert
-
Navigate to Control > Explorer.
-
Click the Actions accordion, then click
(Configuration),
(Add a new Action). -
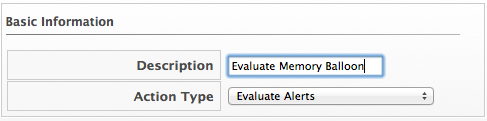
Type in a Description for the action.
-
Select Evaluate Alerts from Action Type.
-
Select the alerts to be evaluated and click
 (Move selected Alerts into this
Action). Use the
(Move selected Alerts into this
Action). Use the Ctrlkey to select multiple alerts.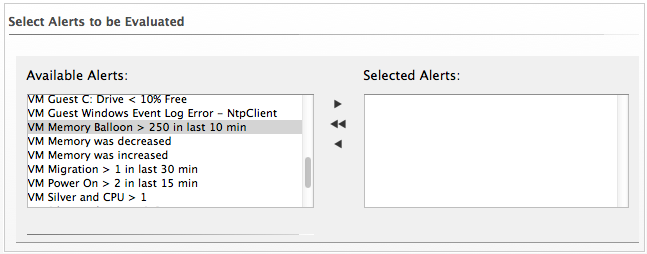
-
Click Add.
Alert Profiles
Creating Alert Profiles
Alert profiles enable you to create groups of standard alerts. An alert profile can have as many alerts assigned as you need, and can be assigned to clusters, datastores, hosts, and virtual machines.
Note:
Each profile type under the Alert Profile accordion menu will have its own Alert Selections and subsequent Assignments choices.
-
Navigate to Control > Explorer.
-
Click on the Alert Profiles accordion, then click on the type of profile that you want to create.
-
Click
(Configuration),
(Add a new Profile). -
In the Basic Information box, type in a unique Description for the alert profile.
-
Select the desired alerts from the Alert Selection area. Use the
Ctrlkey to select multiple alerts. -
Click
to add the Alerts. -
Type in any additional description in the Notes area.
-
Click Add.
Editing an Alert Profile
You can edit an alert profile as your enterprise’s needs change.
-
Navigate to Control > Explorer.
-
Click on the Alert Profiles accordion, then click the alert profile you want to edit.
-
Click
(Configuration),
(Edit this Alert Profile). -
Make the required changes.
-
Click Save.
Deleting an Alert Profile
Remove alert profiles that you no longer need. This does not remove the alerts associated with the alert profile.
-
Navigate to Control > Explorer.
-
Click on the Alert Profiles accordion, then click the alert profile you want to remove.
-
Click
(Configuration),
(Delete this Alert Profile). -
Click OK to confirm.
Assigning an Alert Profile
After an alert profile is created and verified, you can assign it directly to a resource.
-
Navigate to Control > Explorer.
-
Click on the Alert Profiles accordion, then click on the alert profile that you want to assign.
-
Click
(Configuration),
(Edit Assignments for this Alert
Profile). -
The options presented change based on if the alert is for a cluster, datastore, ManageIQ server, host, or virtual machine and instance. You can assign to the enterprise, to specific hosts, cluster, resource pools, and providers, or based on assign tags. For a ManageIQ server alert profile, you can only assign to ManageIQ servers in the current Region.
-
Click Save.
Importing and Exporting
Importing and Exporting Policies, Policy Profiles, and Alerts
If you have multiple VMDBs, you can export policies, policy profiles, or alerts from one to another. You can export and import for use with other ManageIQ infrastructures.
Note:
The appliances you are exporting or importing data between must use the same ManageIQ version.
-
Copy the file to import to a location that is accessible to your ManageIQ console.
-
Navigate to Control > Import/Export.
-
Click Choose file to navigate to the location of the file.
-
Select the file, and then click Open from the file selection box.
-
Click Upload.
-
Verify that these are the policies or policy profiles that you want to import.
-
Click Commit.
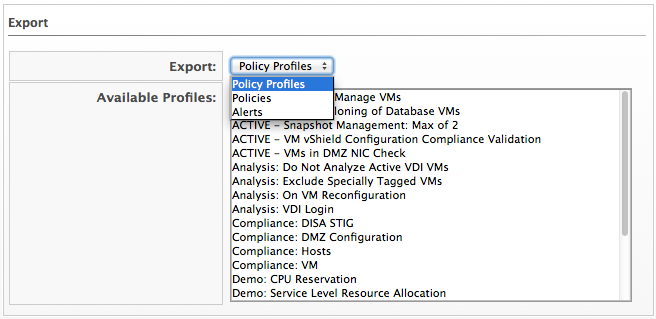
Exporting a Policy, Policy Profile, or an Alert
-
Navigate to Control > Import/Export.
-
From the Export dropdown, select policy profiles, policies, or alerts, depending on what you want to export.
-
From the Available Profiles or Available Policies or Available Alerts list, select the items to export. Use the
Ctrlkey to select multiple items to export into one file. -
Click Export.
-
Follow the prompts in your browser to save the file.
OpenShift Prometheus Alerts
Note:
This feature is currently available as a technology preview only. For more information on the support scope for features marked as technology preview, see Technology Preview Features Support Scope.
Prometheus is used as an external alerting component. ManageIQ integrates Prometheus alerts for use with OpenShift Container Platform. ManageIQ collects events from Prometheus, generates alerts based on these events, and then attaches alerts to inventory objects.
It is possible to view ongoing alerts in ManageIQ by navigating to Monitor > Alerts and manage their life cycle, including the ability to:
-
View active alerts per provider in the Overview screen.
-
View alert data and related objects.
-
Comment, assign, and acknowledge alerts in the All Alerts screen.
Configuring Prometheus Alerts in ManageIQ
Configuring and enabling Prometheus alerts in ManageIQ comprises the following steps:
-
Deploying and configuring Prometheus on OpenShift.
-
Assigning Prometheus alert profiles to the enterprise in ManageIQ.
-
Adding an OpenShift Containers Provider with a Prometheus alert endpoint in ManageIQ.
Deploying and Configuring Prometheus on OpenShift
-
Deploy Prometheus on OpenShift by following the steps covered in Prometheus on OpenShift Container Platform.
-
Add Prometheus to an OpenShift cluster and configure alert definitions. See the example code block below for configuring alerts (currently must be done on the Prometheus side):
$ oc edit configmap -n openshift-metrics prometheus # Supported labels: # severity: ERROR|WARNING|INFO. defaults to ERROR. # Supported annotations: # description: The error message displayed on the screen # miqTarget: ContainerNode|ExtManagementSystem, defaults to ContainerNode. # miqIgnore: "true|false", should ManageIQ pick up this alert, defaults to true. prometheus.rules: | groups: - name: example-rules interval: 30s # defaults to global interval rules: - alert: "NodeDown" << Alert starts here expr: up{job="kubernetes-nodes"} == 0 annotations: miqTarget: "ContainerNode" severity: "ERROR" url: "https://www.example.com/node_down_fixing_instructions" description: "Node is down" - alert: "TooManyRequests" expr: rate(authenticated_user_requests[2m]) > 12 annotations: miqTarget: "ExtManagementSystem" severity: "ERROR" url: "https://www.example.com/too_many_requests_fixing_instructions" description: "Too many authenticated requests" -
Reload the Prometheus configuration. You can do this by deleting the Prometheus pod, then redeploying with the new configuration.
Assigning Prometheus Alert Profiles to the Enterprise
Complete the following procedure to assign Prometheus alert profiles to the enterprise using the ManageIQ user interface.
Note:
Both Node and Provider alert profiles are created automatically during the installation, so it is not required to create these profiles.
-
Navigate to Control > Explorer, then click Alert Profiles in the accordion menu.
-
Click to expand Node Alert Profiles, then click Prometheus Node Profile.
-
Click
(Configuration), then
click (Edit assignments for this Alert
Profile). Assign the profile to The Enterprise from the
Assign To list. -
Click Save.
-
Click to expand Provider Alert Profiles, then click Prometheus Provider Profile.
-
Click Configuration, then click Edit assignments for this Alert Profile. Assign the profile to The Enterprise from the Assign To list.
-
Click Save.
Note:
Alerts triggered before assigning the profiles to the enterprise will not appear in ManageIQ at all.
Adding an OpenShift Containers Provider with a Prometheus Alert Endpoint
Complete the following procedure to add an OpenShift Containers Provider with a Prometheus Alert Endpoint using the ManageIQ user interface.
-
Browse to menu: Compute > Containers > Providers.
-
Click Configuration, then click
(Add a New Containers Provider). -
Enter a Name for the provider.
-
From the Type list, select OpenShift Container Platform.
-
Enter the appropriate Zone for the provider. If you do not specify a zone, it is set to
default. -
In the Default tab, configure the following for the OpenShift provider:
-
Select a Security Protocol method to specify how to authenticate the provider:
-
SSL: Authenticate the provider securely using a trusted Certificate Authority. Select this option if the provider has a valid SSL certificate and it is signed by a trusted Certificate Authority. No further configuration is required for this option.
-
SSL trusting custom CA: Authenticate the provider with a self-signed certificate. For this option, copy your provider’s CA certificate to the Trusted CA Certificates box in PEM format.
Note:
You can obtain your OpenShift Container Platform provider’s CA certificate for all endpoints (default, metrics, alerts) from
/etc/origin/master/ca.crt. Paste the output (a block of text starting with-----BEGIN CERTIFICATE-----) into the Trusted CA Certificates field. -
SSL without validation: Authenticate the provider insecurely (not recommended).
-
-
Enter the Hostname (or IPv4 or IPv6 address) of the provider.
Important:
The Hostname must use a unique fully qualified domain name.
-
Enter the API Port of the provider. The default port is
6443. -
Enter a token for your provider in the Token box.
Note:
To obtain a token for your provider, run the
oc get secretcommand on your provider; see Obtaining an OpenShift Container Platform Management Token.For example:
# oc get secret –namespace management-infra management-admin-token-8ixxs –template=’’ | base64 –decode
-
Click Validate to confirm that ManageIQ can connect to the OpenShift Container Platform provider.
-
-
In the Metrics endpoint tab optionally configure the metrics service details:
-
Select a service type (e.g.: Prometheus) or leave disabled
-
Select a Security Protocol method to specify how to authenticate the service:
-
SSL: Authenticate the provider securely using a trusted Certificate Authority. Select this option if the provider has a valid SSL certificate and it is signed by a trusted Certificate Authority. No further configuration is required for this option.
-
SSL trusting custom CA: Authenticate the provider with a self-signed certificate. For this option, copy your provider’s CA certificate to the Trusted CA Certificates box in PEM format.
-
SSL without validation: Authenticate the provider insecurely using SSL. (Not recommended)
-
-
Enter the Hostname (or IPv4 or IPv6 address) of the metrics service.
In order to find the hostname you can use the
oc get routecommand.You can retrieve the Prometheus route by running:
oc get route prometheus-k8s -n openshift-monitoringExample:
oc get route prometheus-k8s -n openshift-monitoring
NAME             HOST/PORT                                            PATH             SERVICES  PORT      TERMINATION          WILDCARD
prometheus-k8s   prometheus-k8s-openshift-monitoring.ocp.example.com  prometheus-k8s   web       reencrypt/Redirect   None
In this example you would use
prometheus-k8s-openshift-monitoring.ocp.example.comas the metrics hostname. -
Enter the API Port of your metrics endpoint uses a non-standard port for access. The default port is
443. -
Click Validate to confirm that ManageIQ can connect to the metrics endpoint.
-
-
In the Virtualization endpoint tab optionally configure the virtualization service details:
-
Select a service type (OpenShift Virtualization) or leave disabled
-
Select a Security Protocol method to specify how to authenticate the service:
-
SSL: Authenticate the provider securely using a trusted Certificate Authority. Select this option if the provider has a valid SSL certificate and it is signed by a trusted Certificate Authority. No further configuration is required for this option.
-
SSL trusting custom CA: Authenticate the provider with a self-signed certificate. For this option, copy your provider’s CA certificate to the Trusted CA Certificates box in PEM format.
-
SSL without validation: Authenticate the provider insecurely using SSL. (Not recommended)
-
-
Enter the Hostname (or IPv4 or IPv6 address) of the virtualization service.
-
Enter the API Port of your virtualization service. The default port is
443. -
Enter a token for your provider in the Token box.
-
-
Click the Advanced tab to add image inspector settings for scanning container images on your provider using OpenSCAP.
Note:
-
These settings control downloading the image inspector container image from the registry and obtaining the Common Vulnerabilities and Exposures (CVE) information (for effective scanning) via a proxy.
-
CVE URL that ManageIQ requires to be open for OpenSCAP scanning: https://www.redhat.com/security/data/metrics/ds/. This information is based on the source code of OpenSCAP.
-
Enter the proxy information for the provider in either HTTP, HTTPS, or NO Proxy depending on your environment.
-
Enter the Image-Inspector Repository information. For example,
openshift3/image-inspector. -
Enter the Image-Inspector Registry information. For example,
registry.access.redhat.com. -
Enter the Image-Inspector Tag value. A tag is a mark used to differentiate images in a repository, typically by the application version stored in the image.
-
Enter
https://www.redhat.com/security/data/metrics/ds/in CVE location.
-
-
Click Add.
Note:
You can also set global default image-inspector settings for all
OpenShift providers in the advanced settings menu by editing the values
under ems_kubernetes, instead of setting this for each provider.
For example:
:image_inspector_registry: registry.access.redhat.com
:image_inspector_repository: openshift3/image-inspector
Once you have completed the procedure, you will have OpenShift Prometheus alerts enabled in ManageIQ, and can manage their life cyle from the Monitor > Alerts screen in the user interface.
Regular Expressions
In ManageIQ, regular expressions can be used to search the contents of a file for a specific string for use in a condition. Below are listed the items most commonly used with ManageIQ to search strings. These are a small subset of all the items available to use in regular expressions. If you are unfamiliar with regular expressions, there are many resources available on the Internet, including www.regular-expressions.info. Note that if you want to search a file, you must collect it as part of a host analysis profile.
| Anchors | ||
| ^ | start of string | |
| $ | end of string | |
| Character Classes | ||
| \s | white space including spaces, tabs, and line breaks | |
| \S | not white space | |
| \d | digit, same as [0-9] | |
| \D | not digit | |
| \w | word | |
| \W | not word | |
| Quantifiers | ||
| * | 0 or more of preceding characters | |
| + | 1 or more of preceding characters | |
| ? | 0 or 1 of preceding character | |
| Escape Character | ||
| \ | put before a metacharacter to search for that actual character | |
| Metacharacters | ||
| ^ [ . $ { * ( \ + ) | ? < > | must be used with the Escape Character if you are searching specifically for it |
| Special characters | ||
| \n | new line | |
| \t | tab | |
| Groups and Ranges | ||
| . | any character except new line (\n) | |
| (a | b) | a or b |
| () | group | |
| [abc] | a or b or c | |
| [^abc] | not a or b or c | |
| [a-q] | letter between a and q | |
| [A-Q] | upper case letter between A and Q | |
| [0-7] | digit between 0 and 7 | |
| Pattern modifiers | ||
| i | case insensitive | |
| Other helpers | ||
| .* | swallows text between 2 words | |
| \s+ | guarantees minimum of 1 whitespace between 2 words | |
| \s* | guarantees 0 or more whitespace between 2 words | |
| ^\s* | beginning of line with zero or more whitespace | |
| \s+.* | swallows all text and white space between 2 words | |
| \d+ | guarantees minimum of 1 number between 2 words | |
| <\w> | identical to <[a-zA-Z0-(_]> |
Regular Expressions
| Description | Regular Expression | |||
| ([a-zA-Z0-9]+) | Letters, numbers, hyphens | |||
Find the line beginning with sshd. Then, using a colon : as delimiter, check that the value four “:” over is equal to 99999. |
^sshd:[^:]*:[^:]*:[^:]*:99999: | |||
Verify that PASS_MAX_DAYS exists starting in position 1 and a value after it is ⇐ 90. |
^\s*PASS_MAX_DAYS\s+([0-9] | [1-8][0-9] | 90) | |
Verify that ROOTPW (in any case) exists on an uncommented line. |
/[#]*ROOTPW/i | |||
| Verify that line in file starts with size and the value after is ⇐ 4096k. | ^\s*size\s+(409[0-6] | 40[0-8][0-9] | [123][09]{3} | \d{1,3})k |
Find line with string restrict 127.0.0.1 that starts in position `1 to ensure it is not commented out. |
^\s*restrict\s+127\.0\.0\.1 | |||
Find an uncommented line that contains /home. There will be additional text before the desired string. |
[#]*\/home |
Examples
Reportable Fields in ManageIQ
ManageIQ provides a set of out of the box reports covering a variety of areas. These fields are collected by ManageIQ from the different parts of the infrastructure. Most of the fields are named directly as the vendor would name them. However, there are some fields that ManageIQ calculates given this data. Note that this list may vary by Provider and may change as new Providers are added to ManageIQ. Also, note that the value returned by each reportable field below is in megabytes (MB).
| Reportable Field |
|---|
| Memory - Aggregate Used for Child VMs for Collected Intervals 30 Day Avg |
| Memory - Aggregate Used for Child VMs for Collected Intervals 30 Day High Avg |
| Memory - Aggregate Used for Child VMs for Collected Intervals 30 Day Low Avg |
| Datastores : Memory - Aggregate Used for Child VMs for Collected Intervals 30 Day Avg |
| Datastores : Memory - Aggregate Used for Child VMs for Collected Intervals 30 Day High Avg |
| Datastores : Memory - Aggregate Used for Child VMs for Collected Intervals 30 Day Low Avg |
| Hosts : Memory - Aggregate Used for Child VMs for Collected Intervals 30 Day Avg |
| Hosts : Memory - Aggregate Used for Child VMs for Collected Intervals 30 Day High Avg |
| Hosts : Memory - Aggregate Used for Child VMs for Collected Intervals 30 Day Low Avg |
| Miq Templates : Memory - Aggregate Used for Child VMs for Collected Intervals 30 Day Avg |
| Miq Templates : Memory - Aggregate Used for Child VMs for Collected Intervals 30 Day High Avg |
| Miq Templates : Memory - Aggregate Used for Child VMs for Collected Intervals 30 Day Low Avg |
| Miq Templates : Memory - Aggregate Used for Child VMs for Collected Intervals 30 Day Max |
| Provider : Memory - Aggregate Used for Child VMs for Collected Intervals 30 Day Avg |
| Provider : Memory - Aggregate Used for Child VMs for Collected Intervals 30 Day High Avg |
| Provider : Memory - Aggregate Used for Child VMs for Collected Intervals 30 Day Low Avg |
| VMs : Memory - Aggregate Used for Child VMs for Collected Intervals 30 Day Max |
| VMs : Memory - Avg Used for Collected Intervals 30 Day Avg |
| VMs : Memory - Avg Used for Collected Intervals 30 Day High Avg |
Clusters
| Reportable Field |
|---|
| Datastore : Memory - Aggregate Used for Child VMs for Collected Intervals 30 Day Avg |
| Datastore : Memory - Aggregate Used for Child VMs for Collected Intervals 30 Day High Avg |
| Datastore : Memory - Aggregate Used for Child VMs for Collected Intervals 30 Day Low Avg |
| VM Template : Memory - Aggregate Used for Child VMs for Collected Intervals 30 Day Avg |
| VM Template : Memory - Aggregate Used for Child VMs for Collected Intervals 30 Day High Avg |
| VM Template : Memory - Aggregate Used for Child VMs for Collected Intervals 30 Day Low Avg |
| VM Template : Memory - Aggregate Used for Child VMs for Collected Intervals 30 Day Max |
| VM and Instance : Memory - Aggregate Used for Child VMs for Collected Intervals 30 Day Max |
| VM and Instance : Memory - Avg Used for Collected Intervals 30 Day Avg |
| VM and Instance : Memory - Avg Used for Collected Intervals 30 Day High Avg |
| VM and Instance : Memory - Avg Used for Collected Intervals 30 Day Low Avg |
| Memory - Aggregate Used for Child VMs for Collected Intervals 30 Day Avg |
| Memory - Aggregate Used for Child VMs for Collected Intervals 30 Day High Avg |
| Memory - Aggregate Used for Child VMs for Collected Intervals 30 Day Low Avg |
| File Share.File System.Hosts : Memory - Aggregate Used for Child VMs for Collected Intervals 30 Day Avg |
| File Share.File System.Hosts : Memory - Aggregate Used for Child VMs for Collected Intervals 30 Day High Avg |
| File Share.File System.Hosts : Memory - Aggregate Used for Child VMs for Collected Intervals 30 Day Low Avg |
| File Share.File System.Logical Disk.Hosts : Memory - Aggregate Used for Child VMs for Collected Intervals 30 Day Avg |
| File Share.File System.Logical Disk.Hosts : Memory - Aggregate Used for Child VMs for Collected Intervals 30 Day High Avg |
| File Share.File System.Logical Disk.Hosts : Memory - Aggregate Used for Child VMs for Collected Intervals 30 Day Low Avg |
| File Share.File System.Logical Disk.VMs : Memory - Aggregate Used for Child VMs for Collected Intervals 30 Day Max |
| File Share.File System.Logical Disk.VMs : Memory - Avg Used for Collected Intervals 30 Day Avg |
| File Share.File System.Logical Disk.VMs : Memory - Avg Used for Collected Intervals 30 Day High Avg |
| File Share.File System.Logical Disk.VMs : Memory - Avg Used for Collected Intervals 30 Day Low Avg |
| File Share.File System.VMs : Memory - Aggregate Used for Child VMs for Collected Intervals 30 Day Max |
| File Share.File System.VMs : Memory - Avg Used for Collected Intervals 30 Day Avg |
| File Share.File System.VMs : Memory - Avg Used for Collected Intervals 30 Day High Avg |
| File Share.VMs : Memory - Avg Used for Collected Intervals 30 Day Low Avg |
| Hosts : Memory - Aggregate Used for Child VMs for Collected Intervals 30 Day Avg |
| Hosts : Memory - Aggregate Used for Child VMs for Collected Intervals 30 Day High Avg |
| Hosts : Memory - Aggregate Used for Child VMs for Collected Intervals 30 Day Low Avg |
| Miq Templates : Memory - Aggregate Used for Child VMs for Collected Intervals 30 Day Avg |
| Miq Templates : Memory - Aggregate Used for Child VMs for Collected Intervals 30 Day High Avg |
| Miq Templates : Memory - Aggregate Used for Child VMs for Collected Intervals 30 Day Low Avg |
| Miq Templates : Memory - Aggregate Used for Child VMs for Collected Intervals 30 Day Max |
| VMs : Memory - Aggregate Used for Child VMs for Collected Intervals 30 Day Max |
| VMs : Memory - Avg Used for Collected Intervals 30 Day Avg |
| VMs : Memory - Avg Used for Collected Intervals 30 Day High Avg |
| VMs : Memory - Avg Used for Collected Intervals 30 Day Low Avg |
Datastore Files
| Reportable Field |
|---|
| Memory - Aggregate Used for Child VMs for Collected Intervals 30 Day Avg |
| Memory - Aggregate Used for Child VMs for Collected Intervals 30 Day High Avg |
| Memory - Aggregate Used for Child VMs for Collected Intervals 30 Day Low Avg |
| File Share.File System.Hosts : Memory - Aggregate Used for Child VMs for Collected Intervals 30 Day Avg |
| File Share.File System.Hosts : Memory - Aggregate Used for Child VMs for Collected Intervals 30 Day High Avg |
| File Share.File System.Hosts : Memory - Aggregate Used for Child VMs for Collected Intervals 30 Day Low Avg |
| File Share.File System.Logical Disk.Hosts : Memory - Aggregate Used for Child VMs for Collected Intervals 30 Day Avg |
| File Share.File System.Logical Disk.Hosts : Memory - Aggregate Used for Child VMs for Collected Intervals 30 Day High Avg |
| File Share.File System.Logical Disk.Hosts : Memory - Aggregate Used for Child VMs for Collected Intervals 30 Day Low Avg |
| File Share.File System.Logical Disk.VMs : Memory - Aggregate Used for Child VMs for Collected Intervals 30 Day Max |
| File Share.File System.Logical Disk.VMs : Memory - Avg Used for Collected Intervals 30 Day Avg |
| File Share.File System.Logical Disk.VMs : Memory - Avg Used for Collected Intervals 30 Day High Avg |
| File Share.File System.Logical Disk.VMs : Memory - Avg Used for Collected Intervals 30 Day Low Avg |
| File Share.File System.VMs : Memory - Aggregate Used for Child VMs for Collected Intervals 30 Day Max |
| File Share.File System.VMs : Memory - Avg Used for Collected Intervals 30 Day Avg |
| File Share.File System.VMs : Memory - Avg Used for Collected Intervals 30 Day High Avg |
| File Share.File System.VMs : Memory - Avg Used for Collected Intervals 30 Day Low Avg |
| File Share.Hosts : Memory - Aggregate Used for Child VMs for Collected Intervals 30 Day Avg |
| File Share.Hosts : Memory - Aggregate Used for Child VMs for Collected Intervals 30 Day High Avg |
| File Share.Hosts : Memory - Aggregate Used for Child VMs for Collected Intervals 30 Day Low Avg |
| File Share.VMs : Memory - Aggregate Used for Child VMs for Collected Intervals 30 Day Max |
| File Share.VMs : Memory - Avg Used for Collected Intervals 30 Day Avg |
| File Share.VMs : Memory - Avg Used for Collected Intervals 30 Day High Avg |
| File Share.VMs : Memory - Avg Used for Collected Intervals 30 Day Low Avg |
| Hosts : Memory - Aggregate Used for Child VMs for Collected Intervals 30 Day Avg |
| Hosts : Memory - Aggregate Used for Child VMs for Collected Intervals 30 Day High Avg |
| Hosts : Memory - Aggregate Used for Child VMs for Collected Intervals 30 Day Low Avg |
| Miq Templates : Memory - Aggregate Used for Child VMs for Collected Intervals 30 Day Avg |
| Miq Templates : Memory - Aggregate Used for Child VMs for Collected Intervals 30 Day High Avg |
| Miq Templates : Memory - Aggregate Used for Child VMs for Collected Intervals 30 Day Low Avg |
| Miq Templates : Memory - Aggregate Used for Child VMs for Collected Intervals 30 Day Max |
| VMs : Memory - Aggregate Used for Child VMs for Collected Intervals 30 Day Max |
| VMs : Memory - Avg Used for Collected Intervals 30 Day Avg |
| VMs : Memory - Avg Used for Collected Intervals 30 Day High Avg |
| VMs : Memory - Avg Used for Collected Intervals 30 Day Low Avg |
Datastores
| Reportable Field |
|---|
| Miq Templates : Memory - Aggregate Used for Child VMs for Collected Intervals 30 Day Avg |
| Miq Templates : Memory - Aggregate Used for Child VMs for Collected Intervals 30 Day High Avg |
| Miq Templates : Memory - Aggregate Used for Child VMs for Collected Intervals 30 Day Low Avg |
| Miq Templates : Memory - Aggregate Used for Child VMs for Collected Intervals 30 Day Max |
| VMs : Memory - Aggregate Used for Child VMs for Collected Intervals 30 Day Max |
| VMs : Memory - Avg Used for Collected Intervals 30 Day Avg |
| VMs : Memory - Avg Used for Collected Intervals 30 Day High Avg |
| VMs : Memory - Avg Used for Collected Intervals 30 Day Low Avg |
EVM Groups
| Reportable Field |
|---|
| Memory - Aggregate Used for Child VMs for Collected Intervals 30 Day Avg |
| Memory - Aggregate Used for Child VMs for Collected Intervals 30 Day High Avg |
| Memory - Aggregate Used for Child VMs for Collected Intervals 30 Day Low Avg |
| Cluster : Memory - Aggregate Used for Child VMs for Collected Intervals 30 Day Avg |
| Cluster : Memory - Aggregate Used for Child VMs for Collected Intervals 30 Day High Avg |
| Cluster : Memory - Aggregate Used for Child VMs for Collected Intervals 30 Day Low Avg |
| Datastores : Memory - Aggregate Used for Child VMs for Collected Intervals 30 Day Avg |
| Datastores : Memory - Aggregate Used for Child VMs for Collected Intervals 30 Day High Avg |
| Datastores : Memory - Aggregate Used for Child VMs for Collected Intervals 30 Day Low Avg |
| Miq Templates : Memory - Aggregate Used for Child VMs for Collected Intervals 30 Day Avg |
| Miq Templates : Memory - Aggregate Used for Child VMs for Collected Intervals 30 Day High Avg |
| Miq Templates : Memory - Aggregate Used for Child VMs for Collected Intervals 30 Day Low Avg |
| Miq Templates : Memory - Aggregate Used for Child VMs for Collected Intervals 30 Day Max |
| Provider : Memory - Aggregate Used for Child VMs for Collected Intervals 30 Day Avg |
| Provider : Memory - Aggregate Used for Child VMs for Collected Intervals 30 Day High Avg |
| Provider : Memory - Aggregate Used for Child VMs for Collected Intervals 30 Day Low Avg |
| VMs : Memory - Aggregate Used for Child VMs for Collected Intervals 30 Day Max |
| VMs : Memory - Avg Used for Collected Intervals 30 Day Avg |
| VMs : Memory - Avg Used for Collected Intervals 30 Day High Avg |
| VMs : Memory - Avg Used for Collected Intervals 30 Day Low Avg |
Hosts
| Reportable Field |
|---|
| Memory - Aggregate Used for Child VMs for Collected Intervals 30 Day Avg |
| Memory - Aggregate Used for Child VMs for Collected Intervals 30 Day High Avg |
| Memory - Aggregate Used for Child VMs for Collected Intervals 30 Day Low Avg |
| Memory - Aggregate Used for Child VMs for Collected Intervals 30 Day Max |
| Cluster : Memory - Aggregate Used for Child VMs for Collected Intervals 30 Day Avg |
| Cluster : Memory - Aggregate Used for Child VMs for Collected Intervals 30 Day High Avg |
| Cluster : Memory - Aggregate Used for Child VMs for Collected Intervals 30 Day Low Avg |
| Datastore : Memory - Aggregate Used for Child VMs for Collected Intervals 30 Day Avg |
| Datastore : Memory - Aggregate Used for Child VMs for Collected Intervals 30 Day High Avg |
| Datastore : Memory - Aggregate Used for Child VMs for Collected Intervals 30 Day Low Avg |
| Datastores : Memory - Aggregate Used for Child VMs for Collected Intervals 30 Day Avg |
| Datastores : Memory - Aggregate Used for Child VMs for Collected Intervals 30 Day High Avg |
| Datastores : Memory - Aggregate Used for Child VMs for Collected Intervals 30 Day Low Avg |
| Host : Memory - Aggregate Used for Child VMs for Collected Intervals 30 Day Avg |
| Host : Memory - Aggregate Used for Child VMs for Collected Intervals 30 Day High Avg |
| Host : Memory - Aggregate Used for Child VMs for Collected Intervals 30 Day Low Avg |
| Provider : Memory - Aggregate Used for Child VMs for Collected Intervals 30 Day Avg |
| Provider : Memory - Aggregate Used for Child VMs for Collected Intervals 30 Day High Avg |
| Provider : Memory - Aggregate Used for Child VMs for Collected Intervals 30 Day Low Avg |
| Provisioned From Template : Memory - Aggregate Used for Child VMs for Collected Intervals 30 Day Avg |
| Provisioned From Template : Memory - Aggregate Used for Child VMs for Collected Intervals 30 Day High Avg |
| Provisioned From Template : Memory - Aggregate Used for Child VMs for Collected Intervals 30 Day Low Avg |
| Provisioned From Template : Memory - Aggregate Used for Child VMs for Collected Intervals 30 Day Max |
| Provisioned VMs : Memory - Aggregate Used for Child VMs for Collected Intervals 30 Day Avg |
| Provisioned VMs : Memory - Aggregate Used for Child VMs for Collected Intervals 30 Day High Avg |
| Provisioned VMs : Memory - Aggregate Used for Child VMs for Collected Intervals 30 Day Low Avg |
| Provisioned VMs : Memory - Aggregate Used for Child VMs for Collected Intervals 30 Day Max |
| Service.VMs : Memory - Aggregate Used for Child VMs for Collected Intervals 30 Day Max |
| Service.VMs : Memory - Avg Used for Collected Intervals 30 Day Avg |
| Service.VMs : Memory - Avg Used for Collected Intervals 30 Day High Avg |
| Service.VMs : Memory - Avg Used for Collected Intervals 30 Day Low Avg |
Images