- General Configuration
- Settings Overview
- My Settings
- Tasks
- Configuration
- Settings
- Regions
- Region Scope
- Region Settings
- Capacity and Utilization Collection
- Tags
- Company Tag Categories and Tags
- Creating a Tag Category
- Deleting a Tag Category
- Creating a Company Tag
- Deleting a Company Tag
- Importing Tags for Virtual Machines
- Importing Tags for a Virtual Machine from a CSV File
- Importing Custom Values for Virtual Machines and Hosts
- Importing Asset Tags for a Virtual Machine from a CSV File
- Tag Mapping
- Customizing the Help Menu
- Profiles
- Zones
- Servers
- Schedules
- Regions
- Access Control
- Diagnostics
- Region Diagnostics
- Region Aware Server Roles
- Setting the Priority of a Failover Role
- Zone Diagnostics
- Server Diagnostics
- Workers
- Server and Audit Logs
- Collecting Server Logs and Configuration Files
- Setting the Location of the Log Depot for a Specific Server
- Collecting the Current Log Set of a Server
- Collecting All Log Sets from a Server
- Viewing the Server, Audit, and Production Logs
- Viewing the Server Log
- Reloading the Server Log
- Downloading the Server Log
- Viewing the Audit Log
- Reloading the Audit Log
- Downloading the Audit Log
- Viewing the Production Log
- Reloading the Production Log
- Downloading the Production Log
- Database Operations
- Viewing Information on the VMDB
- Database Regions and Replication
- Configuring Database Replication and Centralized Administration
- Backing Up and Restoring ManageIQ in a Kubernetes Based Environment (podified)
- Backing Up and Restoring a Database for an Appliance Based Environment
- Performing a Binary Backup and Restoring the Database
- Running Database Garbage Collection
- Changing the Database Password
- Adding a New Appliance to an Existing Region with a Non-default Password
- Creating a Database Dump
- Enabling Events Syndication
- Enabling Inventory Syndication
- Enabling Metrics Syndication
- Settings
- SmartProxies
- About
- Default Roles
- EvmRole-super_administrator
- EvmRole-administrator
- EvmRole-approver
- EvmRole-auditor
- EvmRole-desktop
- EvmRole-operator
- EvmRole-security
- EvmRole-support
- EvmRole-user
- EvmRole-user_limited_self_service
- EvmRole-user_self_service
- EvmRole-vm_user
- EvmRole-tenant_administrator
- EvmRole-tenant_quota_administrator
- EvmRole-consumption_administrator
- EvmRole-container_administrator
- EvmRole-container_operator
- EvmRole-reader
General Configuration
Settings Overview
Use the Settings menus of the ManageIQ user interface to view or modify the global configuration of your appliance.
Settings
To view or modify global settings for your appliance, click Settings > My Settings to modify. The availability of each menu item depends on the role assigned to your user account. For more information on roles, see Roles.
The following menu items are available from the settings menu:
-
My Settings
This menu is available to all ManageIQ users. The settings in this menu control how elements in the user interface are displayed, time profiles, and tags for the currently logged-in individual user.
-
Tasks
This menu allows you to view virtual machine SmartState Analysis tasks that can be tracked through the console. The status of each task is displayed, including time started, time ended, what part of the task is currently running, and any errors encountered.
Application Settings
The Application Settings menu is now accessible from Settings > Application Settings from the user interface.
This menu allows you to specify enterprise, region, zone, and server settings for your ManageIQ infrastructure. Diagnostics such as logs and the status of processes are also shown here.
My Settings
The options under the My Settings menu allow you to configure user interface display options specific to the user account with which you log in to ManageIQ, such as the default view displayed on login, and personal tags. You can also configure the color scheme, and button options on the main dashboard.
These options are available by clicking Settings > My Settings.
Visual Settings
The options under the Visual menu allow you to configure how user interface elements are displayed in the web user interface. For all options, click Save to update the settings, or click Reset to undo any unsaved changes that have been made on the current screen.
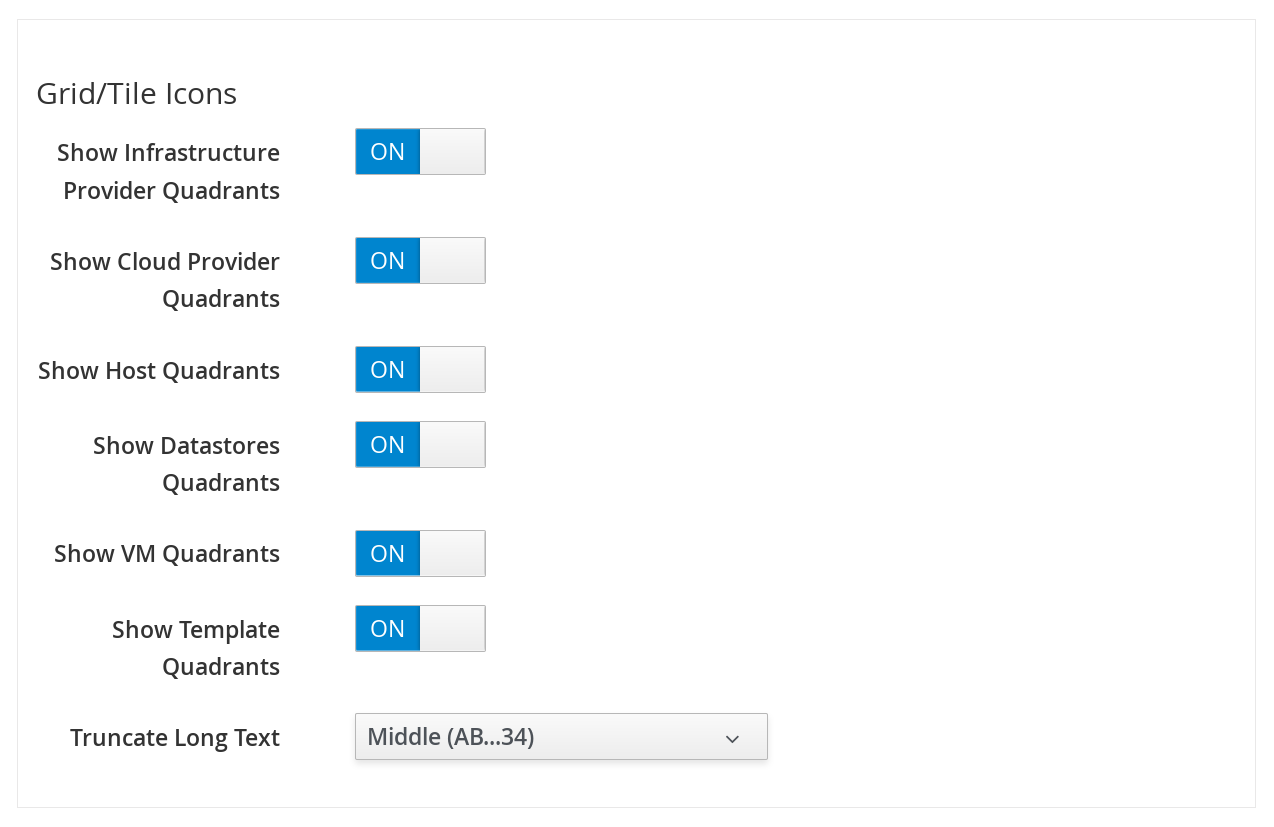
Grid and Tile Icons
This group of settings is used to control the view of your virtual thumbnails. Each thumbnail can be viewed as a single icon or as an icon with four quadrants. Use the quadrant view to see a component’s properties at a glance.
Use the following procedure to change grid and tile icons:
-
From the Settings menu, browse to My Settings, then click on the Visual tab.
-
In Grid/Tile Icons, set items to
ONto display all four quadrants for the item, orOFFto display only one icon. -
Click Save.
-
Set Show Infrastructure Provider Quadrants to
ONto see the four icons in your provider under menu: Compute > Infrastructure > Providers. -
Set Show Cloud Provider Quadrants to
ONto see the four icons in your hosts under menu: Cloud > Providers. -
Set Show Host Quadrants to
ONto see the four icons in your hosts under menu: Compute > Infrastructure > Hosts. -
Set Show Datastores Quadrants to
ONto see the four icons in your datastores under menu: Compute > Infrastructure > Datastores. -
Set Show VM Quadrants to
ONto see the four icons in your virtual machines under menu: Compute > Infrastructure > Virtual Machines. -
Set Show Template Quadrants to
ONto see the four icons in your templates under menu: Compute > Infrastructure > Virtual Machines > Templates.
Set any of the above options to OFF to see only one icon instead of
four quadrants.
- Use the Truncate Long Text list to specify how the names of items are displayed if they are too long to show in full. Select the option based on the pattern shown.
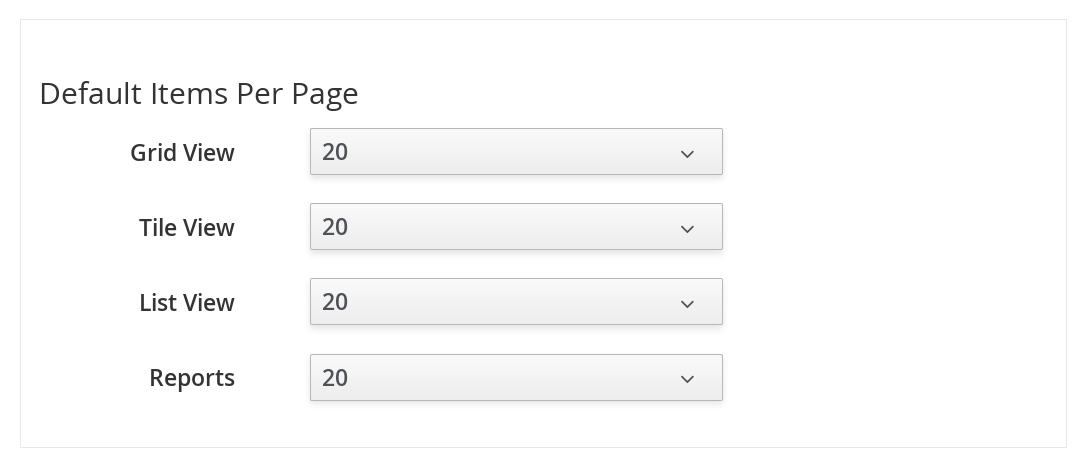
Setting Default Items Per Page
Use the following procedure to set the default number of items to display on each resource page.
-
From the Settings menu, browse to My Settings, then click on the Visual tab.
-
In the Default Items Per Page area, select the default number of items to display for each view from the corresponding drop down list.
-
Click Save.
Setting the Start Page
Use the following procedure to set the default start page after logging in. For example, instead of going to the ManageIQ dashboard, you can set the default start page to see a list of your virtual machines.
-
From the Settings menu, browse to My Settings, then click on the Visual tab.
-
In the Start Page area, select the page to display at login.
-
Click Save.
Setting Display Settings
Use the following procedure to set your own themes, colors, and time zone for the console. These settings are specific to the logged-on user.
-
From the Settings menu, browse to My Settings, then click on the Visual tab.
-
Make selections from Display Settings for the following items:

-
Use Chart Theme to select a group of colors and font sizes specifically for charts.
-
Use Time Zone to select the time zone in which to display the console.
Note:
In time zones where clocks are set forward for daylight savings time, the time zone correctly displays as EDT (Eastern Daylight Time) in the console. When the clocks are set back, it correctly displays as EST (Eastern Standard Time).
-
Use Locale to select the language in which to display the console.
-
-
Click Save.
Default Views
The options under the Default Views menu allow you to configure the default layout used to display individual screens in the ManageIQ user interface. The options you select under this menu specify the default options for each screen, but you can also change the layout for each screen using the layout buttons on each screen.
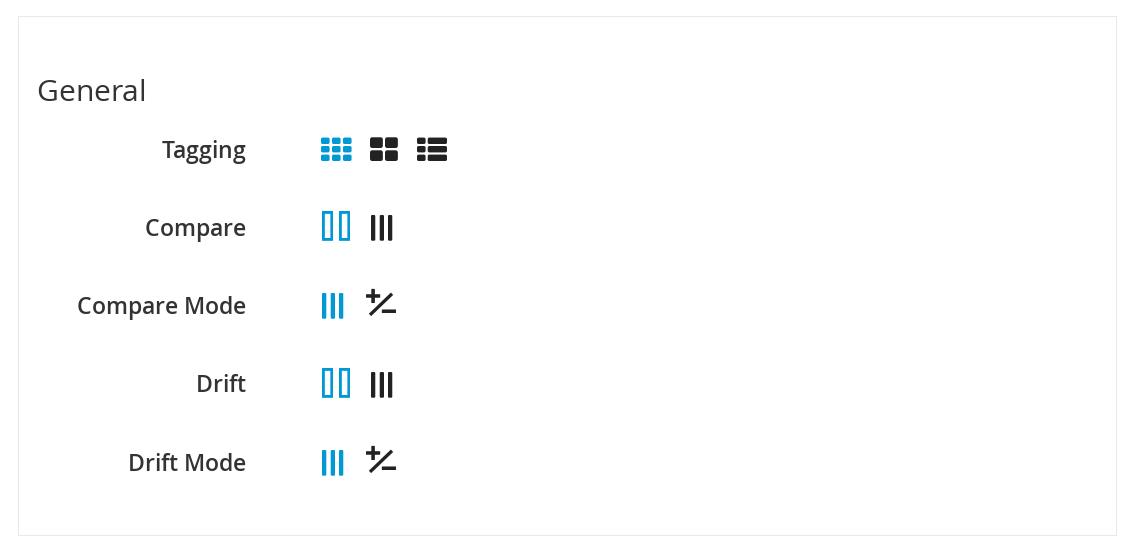
Setting Default Views for the User Interface
Use the following procedure to set general view options:
-
From the Settings menu, browse to My Settings, then click on the Default Views tab.
-
In the General area, click the appropriate button for the way you want to view each type of screen listed. The selected view shows as a blue icon.
-
Click
 Grid View to view virtual
thumbnails or icons.
Grid View to view virtual
thumbnails or icons. -
Click
 Tile View for a view that
combines the virtual thumbnail with some text properties that
describe the items.
Tile View for a view that
combines the virtual thumbnail with some text properties that
describe the items. -
Click
 List View to view a detailed
text listing.
List View to view a detailed
text listing. -
Click
 Expanded View for an expanded
view.
Expanded View for an expanded
view. -
Click
 Compressed View for a
compressed view.
Compressed View for a
compressed view. -
Click
 Exists Mode to view only
whether an attribute exists or not.
Exists Mode to view only
whether an attribute exists or not. -
Click Save.
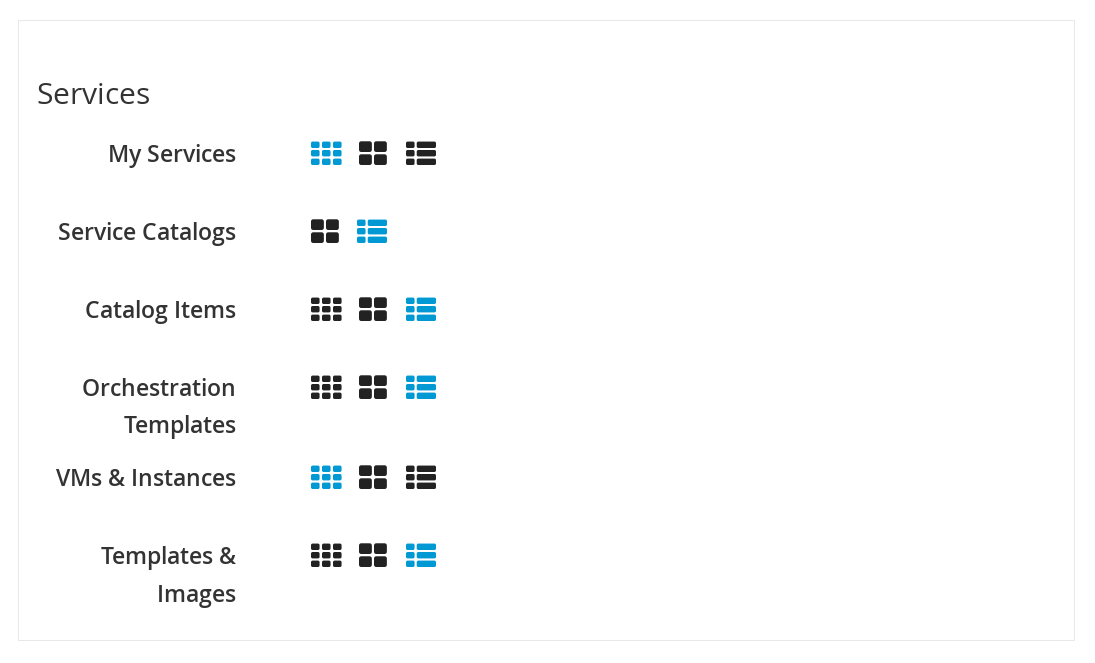
Setting Default Views for Services
Use the following procedure to set default views for services in the menu: Compute > Services tab.
-
From the Settings menu, browse to My Settings, then click on the Default Views tab.
-
In the Services area, click the appropriate button for the way you want to view each item.
-
Click
Grid View to view virtual
thumbnails or icons. -
Click
Tile View for a view that
combines the virtual thumbnail with some text properties that
describe the items. -
Click
List View to view a text
listing.
-
-
Click Save.
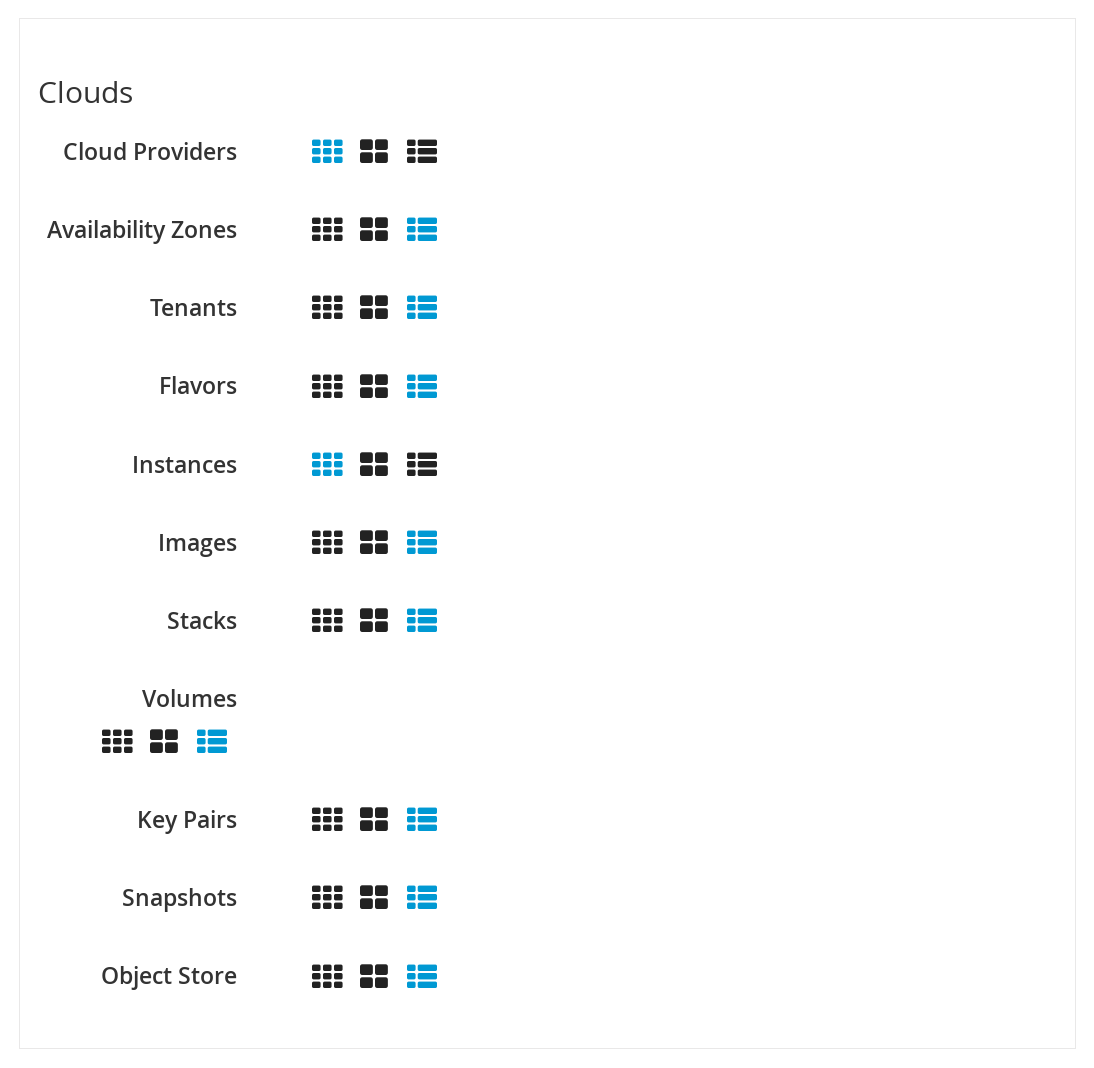
Setting Default Views for Clouds
Use the following procedure to set default views for clouds in the menu: Compute > Clouds tab.
-
From the Settings menu, browse to My Settings, then click on the Default Views tab.
-
In the Clouds area, click the appropriate button for the way you want to view each item.
-
Click
Grid View to view virtual
thumbnails or icons. -
Click
Tile View for a view that
combines the virtual thumbnail with some text properties that
describe the items. -
Click
List View to view a
detailed text listing.
-
-
Click Save.
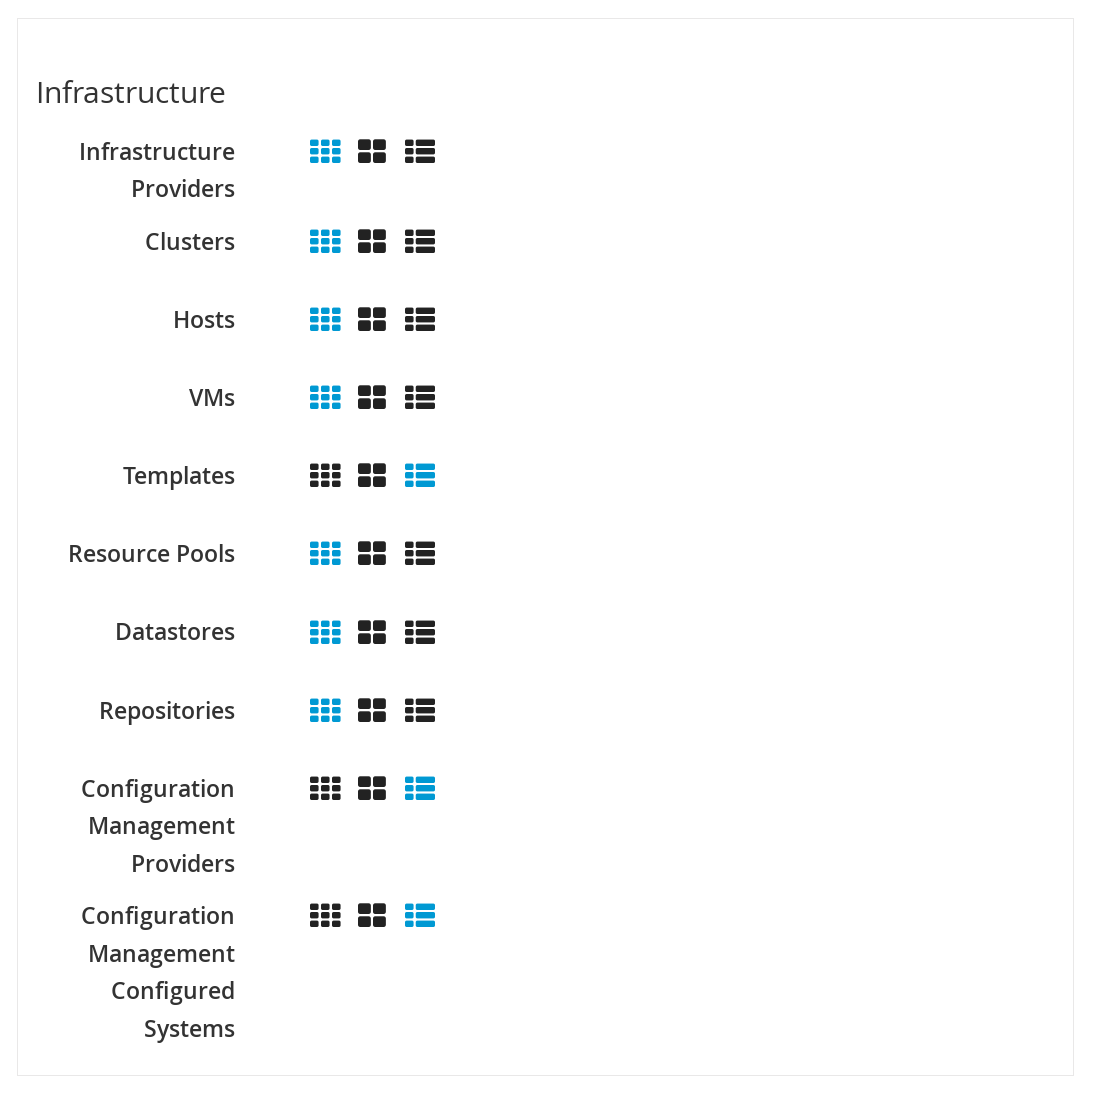
Setting Default Views for Infrastructure Components
Use the following procedure to set default views for infrastructure components in the menu: Compute > Infrastructure tab.
-
From the Settings menu, browse to My Settings, then click on the Default Views tab.
-
In the Infrastructure area, click the appropriate button for the way you want to view each item.
-
Click
Grid View to view virtual
thumbnails or icons. -
Click
Tile View for a view that
combines the virtual thumbnail with some text properties that
describe the items. -
Click
List View to view a
detailed text listing.
-
-
Click Save.
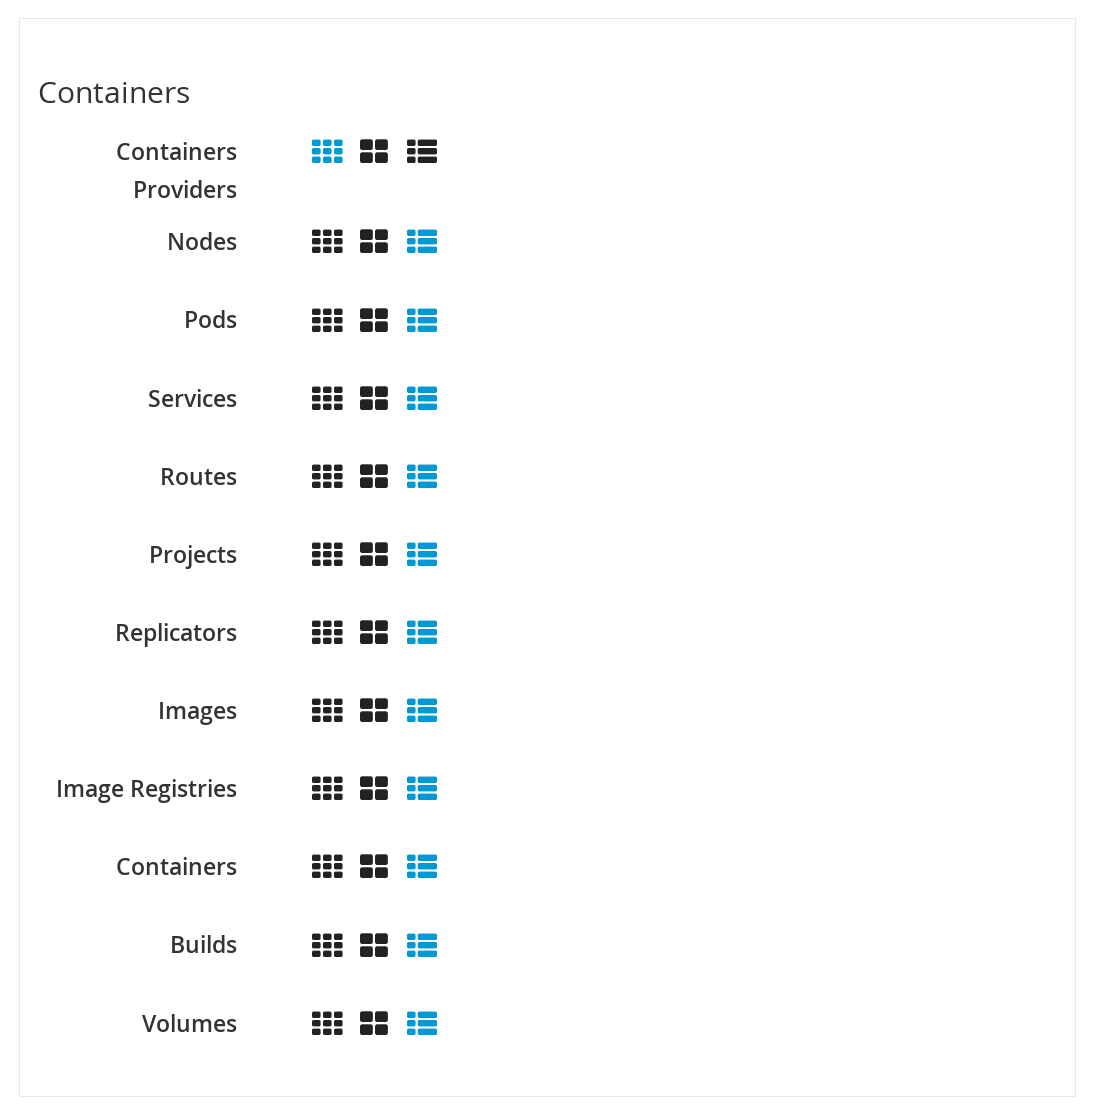
Setting Default Views for Containers
Use the following procedure to set default views for containers in the menu: Compute > Containers tab.
-
From the Settings menu, browse to My Settings, then click on the Default Views tab.
-
In the Containers area, click the appropriate button for the way you want to view each item.
-
Click
Grid View to view virtual
thumbnails or icons. -
Click
Tile View for a view that
combines the virtual thumbnail with some text properties that
describe the items. -
Click
List View to view a text
listing.
-
-
Click Save.
Default Filters
The options in the Default Filters menu allow you to configure the default filters displayed for your hosts, virtual machines, and templates. These settings are available to all users.
Setting Default Filters for Cloud
To set default filters for cloud components:
-
From the Settings menu, browse to My Settings, then click on the Default Filters tab.
-
From the Cloud folder, check the boxes for the default filters that you want available. Items that have changed show in blue text.
-
Click Save.
Setting Default Filters for Containers
To set default filters for containers:
-
From the Settings menu, browse to My Settings, then click on the Default Filters tab.
-
From the Containers folder, check the boxes for the default filters that you want available. Items that have changed show in blue text.
-
Click Save.
Setting Default Filters for Infrastructure
To set default filters for infrastructure components:
-
From the Settings menu, browse to My Settings, then click on the Default Filters tab.
-
In the Infrastructure folder, select the default filters that you want available. Items that have changed show in blue text.
-
Click Save.
Setting Default Filters for Physical Infrastructure
To set default filters for physical infrastructure components:
-
From the Settings menu, browse to My Settings, then click on the Default Filters tab.
-
In the Physical Infrastructure folder, select the default filters that you want available. Items that have changed show in blue text.
-
Click Save.
Setting Default Filters for Services
To set default filters for services:
-
From the Settings menu, browse to My Settings, then click on the Default Filters tab.
-
In the Services folder, select the default filters that you want available. Items that have changed show in blue text.
-
Click Save.
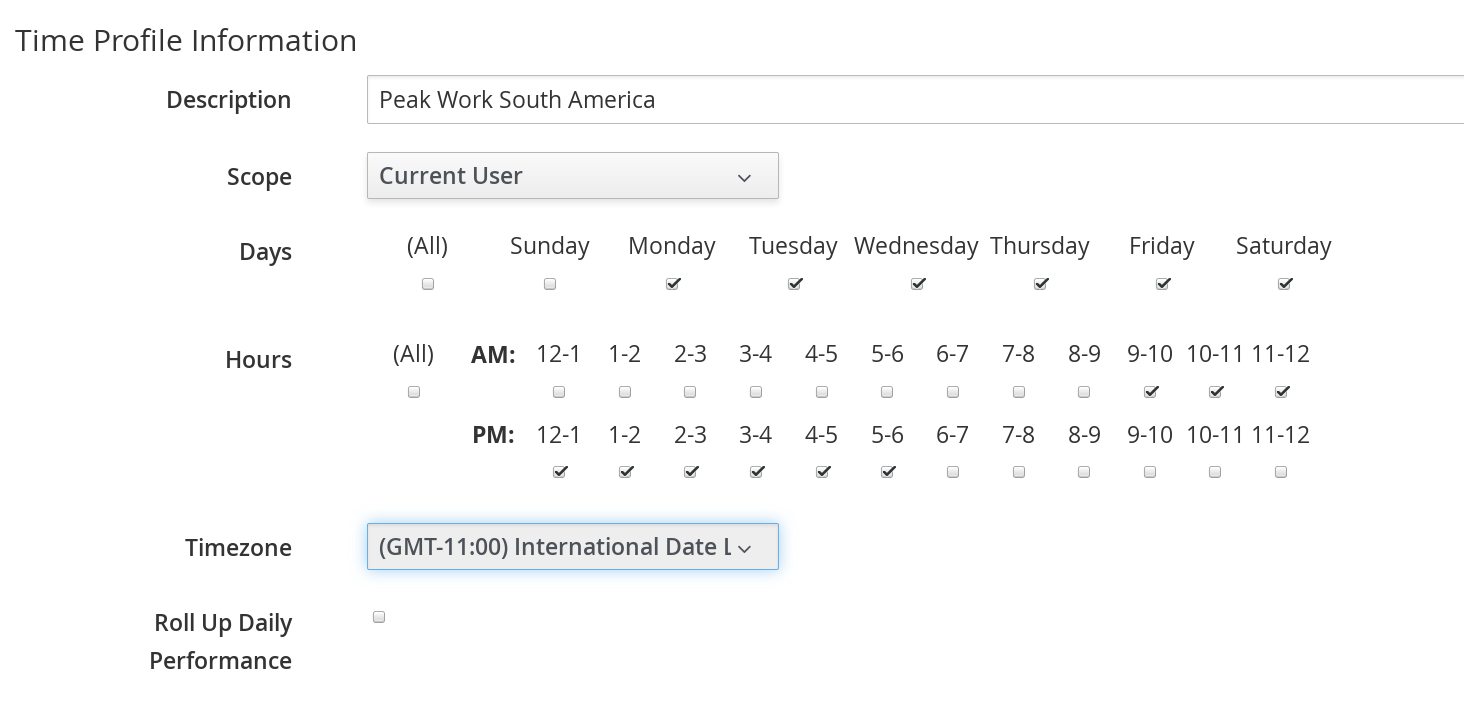
Time Profiles
The options under the Time Profiles menu allow you to specify the hours for which data is displayed when viewing capacity and utilization screens. Time profiles are also used to configure performance and trend reports.
Creating a Time Profile
To create a time profile:
-
From the Settings menu, browse to My Settings, then click on the Time Profiles tab.
-
Click Configuration, and
 Add a new Time Profile.
-
Type a meaningful name in the Description field.
-
Select the users who can access the time profile from the Scope list:
-
Select All Users to create a time profile that is available to all users. Only the super administration and administration roles can create, edit, and delete a global profile.
-
Select Current User if this time profile should only be available to the user creating it.
-
-
Check the Days and Hours for the time profile.
-
For Timezone, you can select a specific time zone or, you can let the user select a time zone when displaying data.
-
If you select a specific time zone, you also have the option to Roll Up Daily Performance data. This option is only available to users with the administration or super administration role. Enabling the Roll Up Daily Performance option reduces the time required to process daily capacity and utilization reports and to display daily capacity and utilization charts.
-
Click Add.
Note:
The following relationships exist between time zones and performance reports:
-
The configured time zone in a performance report is used to select rolled up performance data, regardless of the user’s selected time zone.
-
If the configured time zone is null, it defaults to UTC time for performance reports.
-
If there is no time profile with the report’s configured time zone that is also set to roll up capacity and utilization data, the report does not find any records.
For non-performance reports, the user’s time zone is used when displaying dates and times in report rows.
Editing a Time Profile
To edit a time profile:
-
From the Settings menu, browse to My Settings, then click on the Time Profiles tab.
-
Check the time profile you want to edit.
-
Click Configuration, and
 Edit selected Time Profile.
 -
Make the required changes.
-
Click Save.
Copying a Time Profile
To copy a time profile:
-
From the Settings menu, browse to My Settings, then click on the Time Profiles tab.
-
Check the time profile you want to copy.
-
Click Configuration, and
 Copy selected Time Profile.
 -
Make the required changes.
-
Click Save.
Deleting a Time Profile
To delete a time profile:
-
From the Settings menu, browse to My Settings, then click on the Time Profiles tab.
-
Check the time profile you want to delete.
-
Click Configuration, and
 Delete selected Time Profiles.
 -
Click Save.
Tasks
The options under the Tasks menu allow you to view and control currently running tasks in ManageIQ. The status of each task is displayed, including time started, time ended, what part of the task is currently running, and any errors encountered.
My VM and Container Analysis Tasks
The My VM and Container Analysis Tasks menu allows you to view all tasks running on virtual machines and containers for the currently logged-in user.
From the My VM and Container Analysis Tasks menu, you can:
-
See jobs that the logged on user created for the SmartProxy either through a schedule or by manually initiating a SmartState Analysis of a virtual machine or container.
-
See if a job completed successfully, resulted in an error, or is running.
-
See the reason for an error.
-
Filter the tasks by status and state.
-
View the owner or host of the virtual machine or container referenced.
-
Delete a task either explicitly or older than another task.
Filtering the VM and Container Analysis Task List
This procedure describes how to filter the virtual machine and container analysis task list. You can filter the task list by zone, time period, task status, and task state.
To filter the virtual machine and container analysis task list:
-
From the Settings menu, select Tasks.
-
Click My VM and Container Analysis Tasks.
-
From the Zone list, select a specific zone, or select All Zones.
-
From the 24 Hour Time Period list, select the period of time to view the tasks.
-
For Task Status, select the check boxes next to the status to view.
-
From the Tasks State list, select the state to view.
-
Click Apply.
Deleting a Task from the VM and Container Analysis Task List
To delete a task from the list of virtual machine and container analysis tasks:
-
From the Settings menu, select Tasks.
-
Click My Tasks.
-
Select the tasks to delete. From the Delete menu:
-
Click Delete to delete the selected tasks.
-
Click Delete Older to delete the tasks older than the selected tasks.
-
Click Delete All to delete all tasks.
-
-
Click OK.
My Other UI Tasks
The My Other UI Tasks menu allows you to view all tasks running in the user interface for the currently logged-in user.
Filtering the My Other UI Tasks List
This procedure describes how to filter the user interface analysis task list. You can filter the task list by time period, task status, and task state.
To filter the other user interface task list:
-
From the settings menu, select Tasks.
-
Click My Other UI Tasks.
-
From the 24 Hour Time Period list, select the period of time to view the tasks.
-
For Task Status, select the check boxes next to the status to view.
-
From the Tasks State list, select the state to view.
-
Click Apply.
Deleting a My Task
To delete a task from the list of other user interface tasks:
-
From the settings menu, select Tasks.
-
Click My Tasks.
-
Select the tasks to delete. From the Delete menu:
-
Click Delete to delete the selected tasks.
-
Click Delete Older to delete the tasks older than the selected tasks.
-
Click Delete All to delete all tasks.
-
-
Click OK.
All Tasks
The All Tasks menu allows you to view all tasks running on virtual machines and containers for all users.
From the All Tasks menu, you can:
-
See jobs that all users have created for the SmartProxy either through a schedule or by manually initiating a SmartState Analysis of a virtual machine or container.
-
See if a job completed successfully, resulted in an error, or is running.
-
See the reason for an error.
-
Filter the tasks by status and state.
-
View the owner or host of the virtual machine or container referenced.
-
Delete a task either explicitly or older than another task.
Filtering the VM and Container Analysis Task List
This procedure describes how to filter virtual machine analysis task lists. You can filter the task list by zone, time period, task status, and task state.
To filter the virtual machine and container analysis task list:
-
From the Settings menu, select Tasks.
-
Click All Tasks.
-
From the Zone list, select a specific zone, or select All Zones.
-
From the 24 Hour Time Period list, select the period of time to view the tasks.
-
For Task Status, select the check boxes next to the status to view.
-
From the Tasks State list, select the state to view.
-
Click Apply.
Deleting a VM and Container Analysis Task
To delete a task from the list of all virtual machine and container analysis tasks:
-
From the settings menu, select Tasks.
-
Click All Tasks.
-
Select the tasks to delete. From the Delete menu:
-
Click Delete to delete the selected tasks.
-
Click Delete Older to delete the tasks older than the selected tasks.
-
Click Delete All to delete all tasks.
-
-
Click OK.
All Tasks
The All Tasks menu allows you to view all tasks for all users. This menu is only accessible when you are logged in as the admin user.
Filtering the All Tasks List
This procedure describes how to filter the list of all other tasks. You can filter the task list by time period, task status, and task state.
To filter the all other tasks list:
-
From the Settings menu, select Tasks.
-
Click All Tasks.
-
From the 24 Hour Time Period list, select the period of time to view the tasks.
-
For Task Status, select the check boxes next to the status to view.
-
From the Tasks State list, select the state to view.
-
Click Apply.
Deleting a Task from the All Tasks List
To delete a task from the list of all other tasks:
-
From the settings menu, select Tasks.
-
Click All Tasks.
-
Select the tasks to delete. From the Delete menu:
-
Click Delete to delete the selected tasks.
-
Click Delete Older to delete the tasks older than the selected tasks.
-
Click Delete All to delete all tasks.
-
-
Click OK.
Configuration
The options under the  Configuration menu allow you to configure global options for your
ManageIQ environment, view diagnostic information, and view
analytics on the servers in the environment. The menu displays the
ManageIQ environment at the enterprise, zone, and server levels.
Configuration menu allow you to configure global options for your
ManageIQ environment, view diagnostic information, and view
analytics on the servers in the environment. The menu displays the
ManageIQ environment at the enterprise, zone, and server levels.
There are four main areas:
-
Settings
This menu allows you to configure global settings for your ManageIQ infrastructure. You can also create analysis profiles and schedules for these profiles.
-
Access Control
This menu contains options for configuring users, groups, roles, and tenants.
-
Diagnostics
This menu displays the status of your servers and their roles and provides access to logs.
-
Database
specify the location of your Virtual Machine Database (VMDB) and its login credentials.
Settings
The options under the Settings area provide a hierarchical view of options that allow you to configure global options for the infrastructure of your ManageIQ environment. At the top level, you have Settings including users, LDAP Groups, account roles, capacity and utilization collection, tag categories, values, and imports, custom variable imports, and license uploads. When you click on Settings and expand it, you can configure Analysis Profiles, Zones, and Schedules.
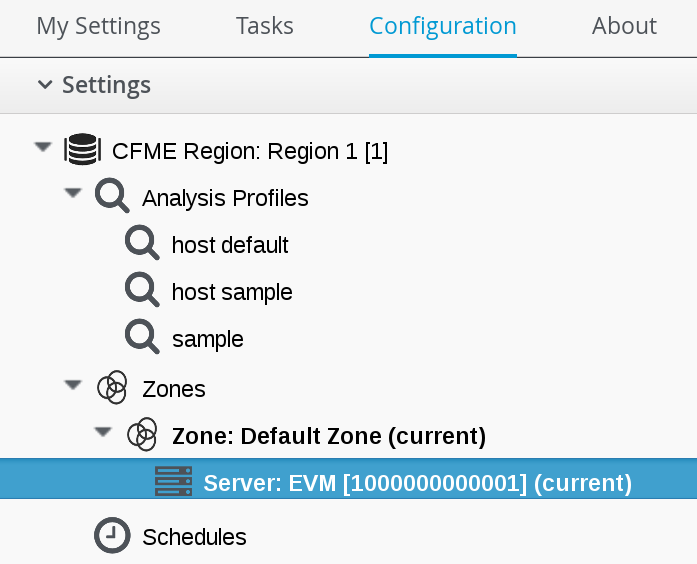
When you go the Settings accordion, you are automatically taken to the server list under Zones.
Regions
Use Regions for centralizing data which is collected from public and private virtualization environments. A region is ultimately represented as a single database for the VMDB. Regions are particularly useful when multiple geographical locations need to be managed as they enable all the data collection to happen at each particular location and avoid data collection traffic across slow links between networks.
When multiple regions are being used, each with their own unique ID, a master region can be created to centralize the data of all the children regions into a single master database. To do this, configure each child region to replicate its data to the master region database (Red Hat recommends use of region 99). This parent and child region is a one-to-many relationship.
Regions can contain multiple zones, which in turn contain appliances. Zones are used for further segregating network traffic along with enabling failover configurations. Each appliance has the capability to be configured for a number of specialized server roles. These roles are limited to the zone containing the appliance they run on.
Only one failover type of each server role can run in a zone. If multiple appliances have the same failover role, the extras are used as backups that activate only if the primary appliance fails. Non-failover server roles can run on multiple appliances simultaneously in a zone, so resources can be adjusted according to the workload those roles are responsible for.
The following diagram demonstrates an example of the multiple regions working together in a ManageIQ environment.
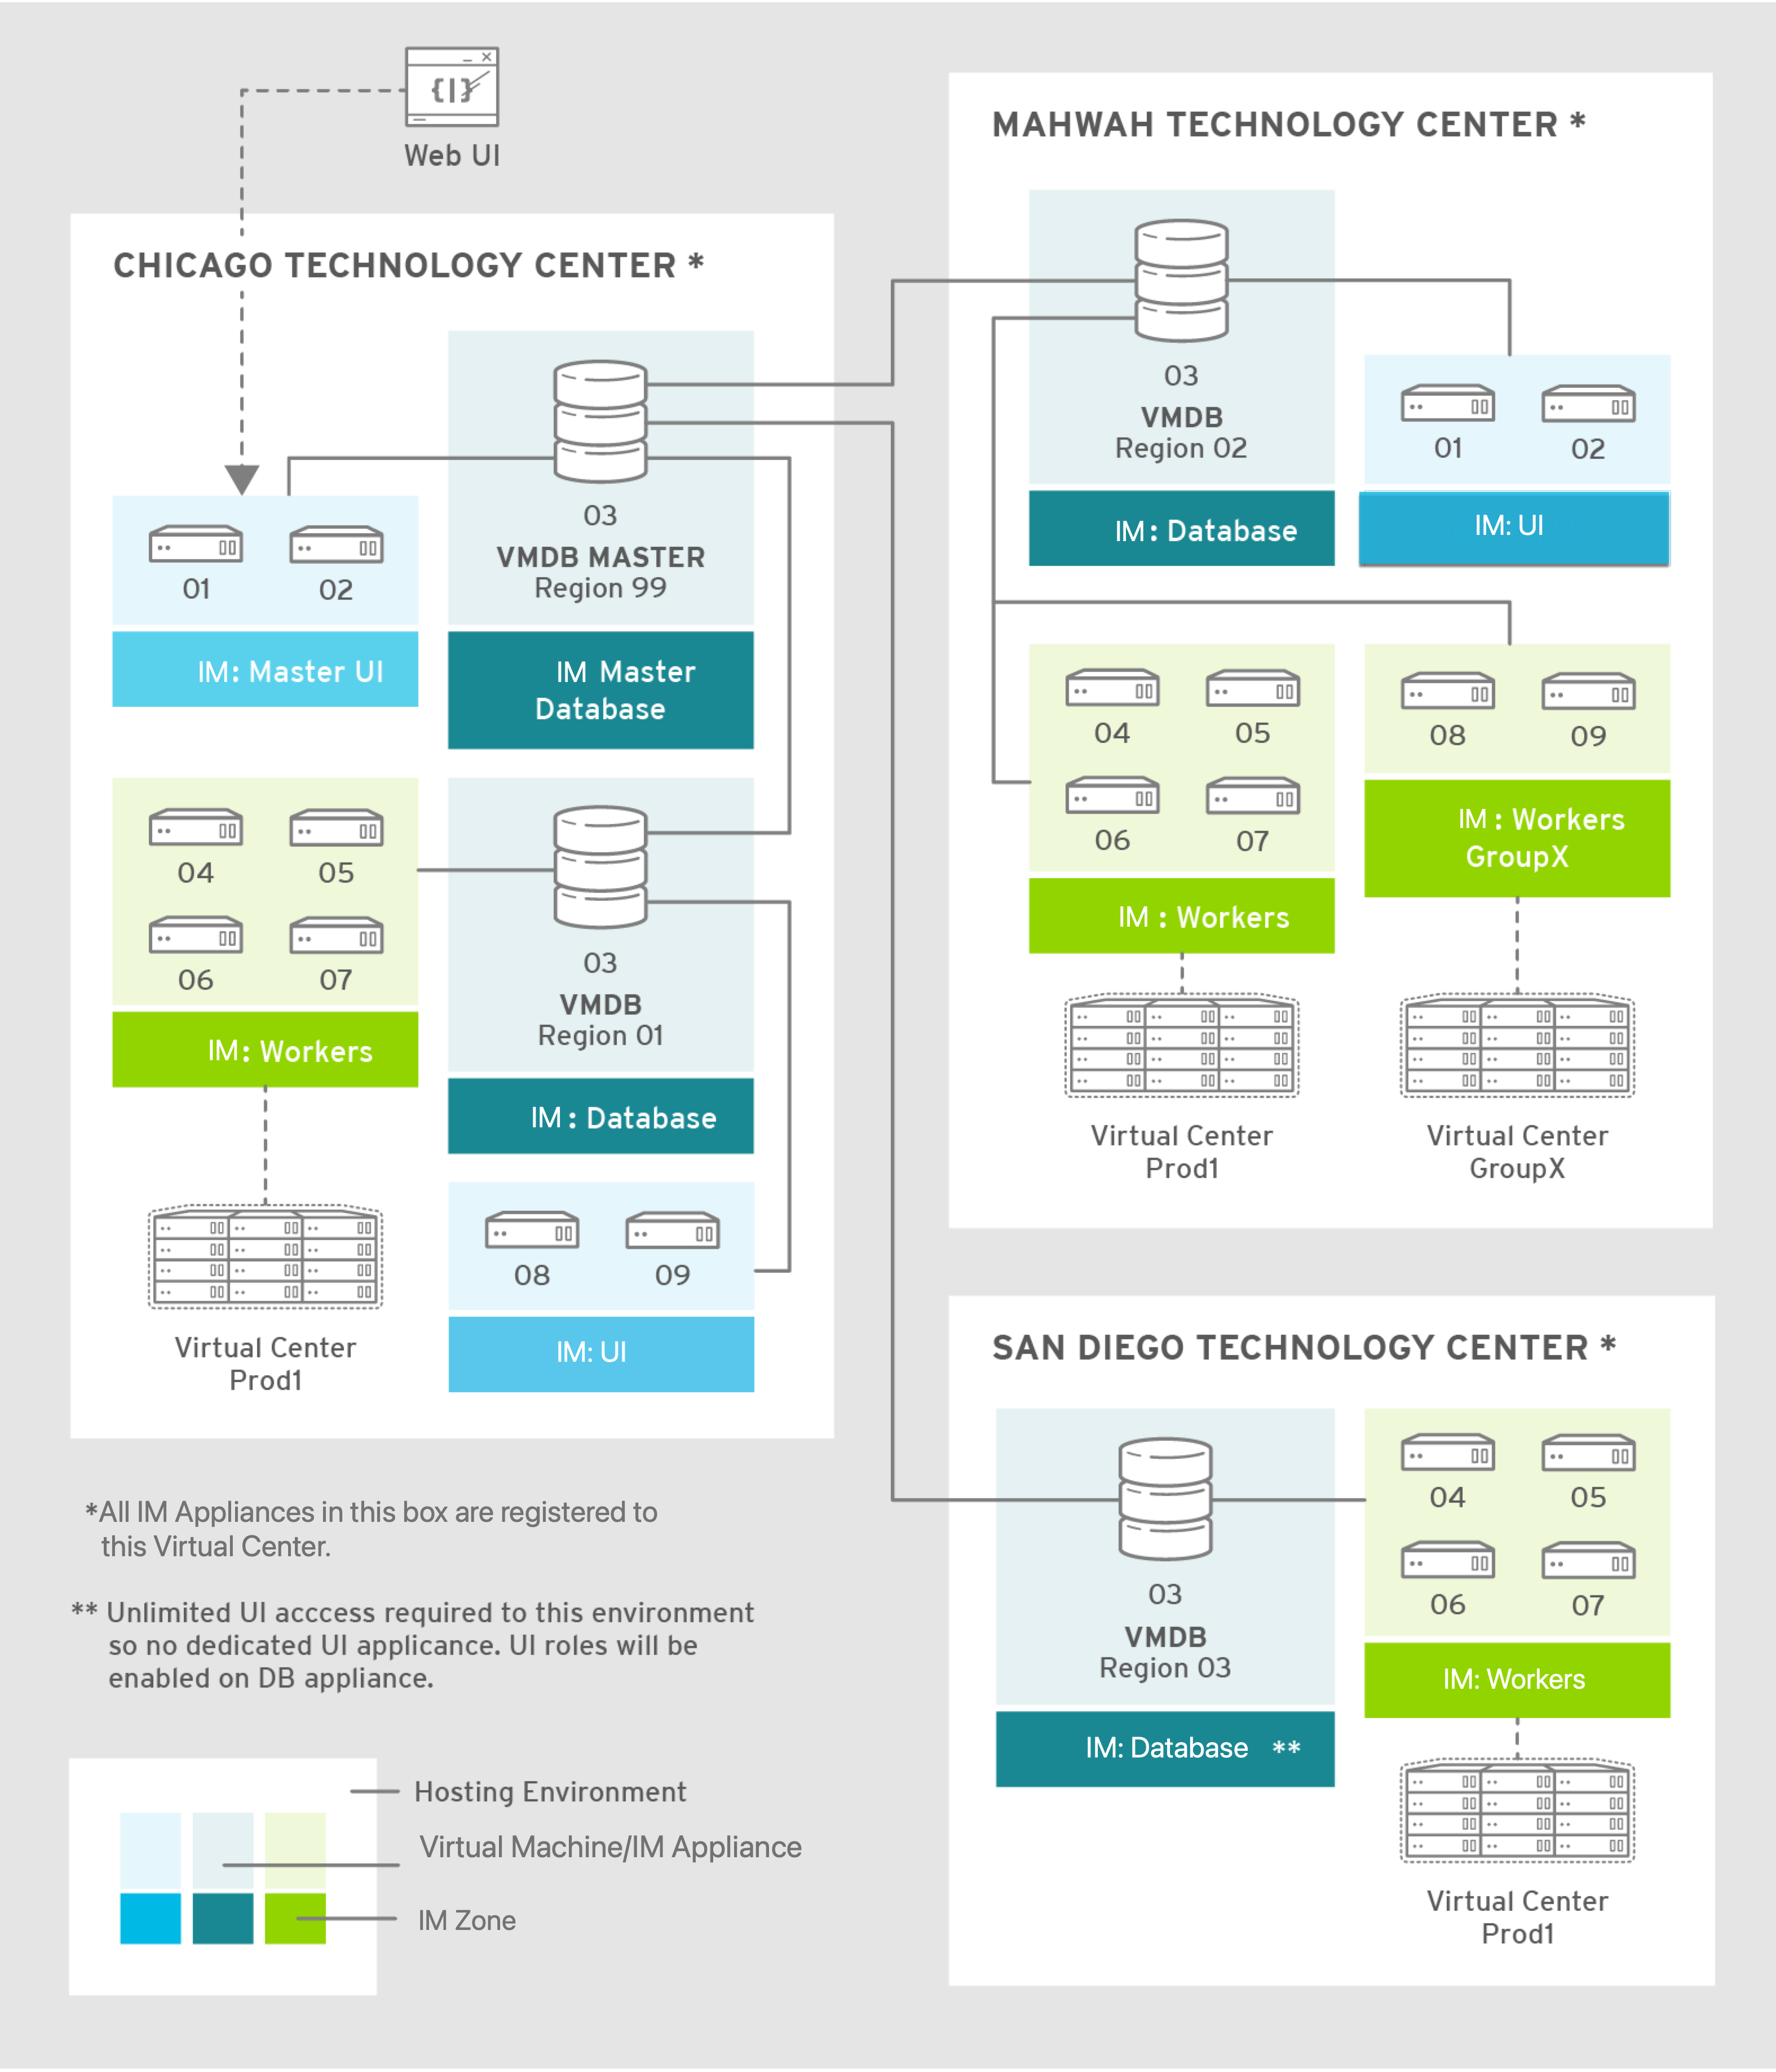
The Master appliance is located in Chicago and contains a master region and a subregion that manages the worker appliances. The Mahwah technology center contains a single subregion that manages two zones. Likewise the San Diego technology center contains a single subregion managing a single zone.
Note:
-
Replicating a parent region to a higher-level parent is not supported.
-
Parent regions can be configured after the child regions are online.
The following diagram provides a closer look at a region:

In this region, we have several ManageIQ appliances acting as UI nodes and worker nodes. These worker nodes execute tasks on the providers in your environment. The Region also uses a region database that reports to a master database on the main ManageIQ appliance. All appliances can connect to the authentication services (Active Directory, LDAP, Identity Management), outgoing mail (SMTP), and network services (SNMP).
Region Scope
Regions are used to consolidate data from multiple VMDBs to a central database. The database at the top level, the master VMDB, cannot be used for operational tasks such as SmartState Analysis or Capacity and Utilization data collection. It is intended for use as a reporting database that includes all information across multiple subordinate regions. The subordinate regions replicate their information to the master.
Note:
The subordinate regions are not aware of each other from a database perspective. You cannot see information from one subordinate region in another. The only VMDB with data visibility to all subordinate regions is the top level.
Master Regions Scope
-
Reports all information from all subordinate VMDBs reporting up to it.
-
Can perform power operations on virtual machines from subordinate regions.
-
Controls its own access control list.
Subordinate Regions Scope
-
Each subordinate controls its own access control independent of the other regions.
-
Can only do work (such as SmartState Analysis and Capacity and Utilization collection) in its own region.
-
Has no knowledge of the other regions.
-
Replicates its data up to the master region.
Region Settings
In the Region area, set items that apply to your entire ManageIQ infrastructure such as users, LDAP Groups, capacity and utilization collection, company tags and tag categories, and licensing. Regions are also used for database replication.
Capacity and Utilization Collection
Capacity and Utilization Collection Settings
Use C & U Collection Settings to select specifically which clusters and datastores you want to collect usage data for. By selecting a cluster, you are choosing to collect data for all hosts and virtual machines that are part of that cluster. You must also have a server with the Capacity & Utilization Coordinator, Data Collector, and Data Processor roles enabled as well. See Section Server Control Settings.
After a provider has been discovered and its relationships refreshed, view the clusters, hosts, and datastores from the settings menu. Navigate to Settings, then click on Application Settings. Click the menu: Settings > Region, then select the C & U Collection tab.
Enabling a Cluster, Host, or Datastore for Capacity and
Utilization Collection
To enable a cluster, host, or datastore for Capacity and Utilization Collection:
-
Click Settings, then click on Application Settings.
-
Click the Settings accordion, then select Region, then click on the C & U Collection tab.
-
In the Clusters area, check all clusters and hosts that you want to collect data for.
-
In the Datastores area, check all datastores that you want to collect data for.
-
Click Save.
Note:
-
As new clusters, hosts, and datastores are discovered, you will need to come back to this configuration to enable collection of capacity and utilization data unless you have used the Collect for All check boxes.
-
Collect for All Clusters must be checked to be able to collect capacity and utilization data from cloud providers such as Red Hat OpenStack Platform or Amazon EC2.
Tags
Company Tag Categories and Tags
ManageIQ allows you to create your own set of tags and tag categories. Use tags to create a customized, searchable index for your resources. Depending on your database type, your tags may be case sensitive. After creating these values, you can apply them to your resources. There are two kinds of tags.
-
Company tags which you will see under My Company Tags for a resource. Create company tags from the settings menu. Browse to Settings > Application Settings. Click the Settings accordion, then select the Region and click on the Tags tab, then My Company Tags. A selection of company tags is provided to you by default as samples. These can be deleted if you do not need them, but are not recreated by ManageIQ.
-
System tags are assigned automatically by ManageIQ.
Creating a Tag Category
To create a tag category:
-
Browse to Settings > Application Settings.
-
Click on the Settings accordion, then Region.
-
Select the Tags tab, then click on the My Company Categories tab.
-
Click Add under the Actions column to create a new category.
-
In the Category Information area:
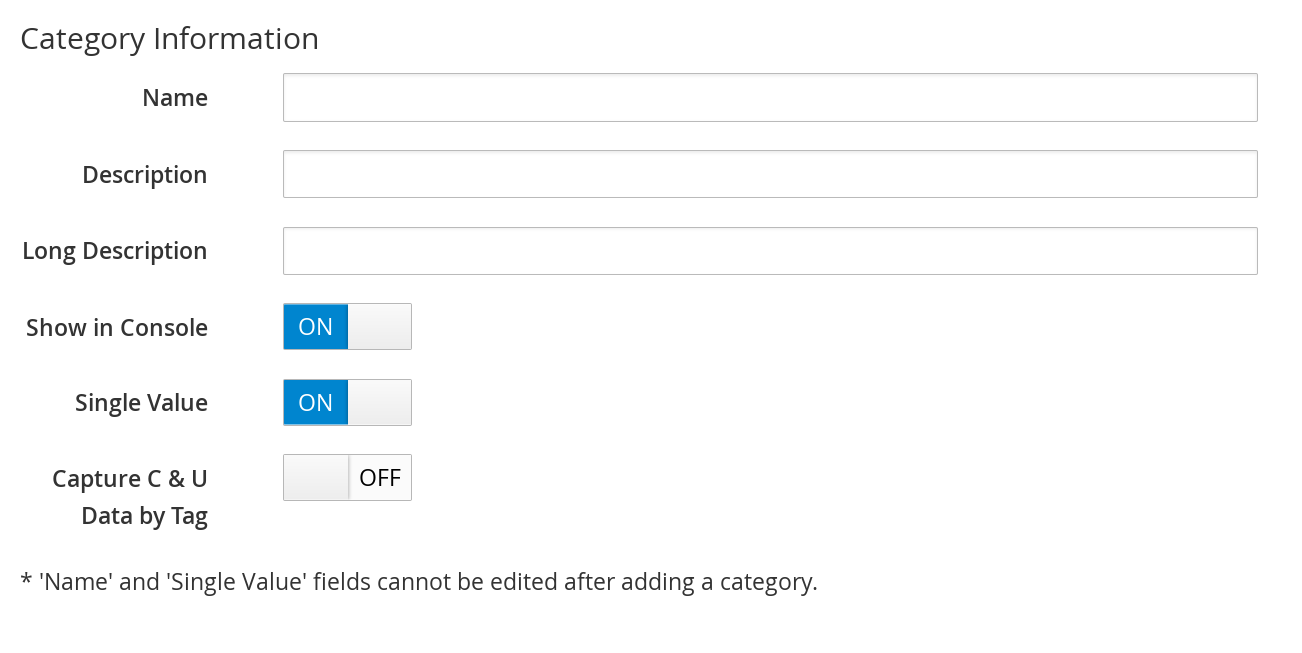
-
Use Name to create a short name that refers to category in the VMDB.
Note:
The Name and Single Value fields cannot be changed after the category has been added.
-
Use Description to type a brief explanation of how the category should be used. This shows when you try to add a value to the category.
-
Use Long Description to type a detailed explanation of the category.
-
Set Show in Console to
ONwhen the category is ready for use in the console. For example, you want to populate values for the category before exposing it to users. -
Set Single Value to
ONfor categories that can only have a single value assigned to a resource. For example, a virtual machine can only be assigned to one location, but could belong to more than one department. This cannot be changed after the category is created. -
Set Capture C & U Data by Tag to
ONfor the ability to group capacity and utilization data by this tag category. To use this, be sure to assign this tag to all the resources that you want to group by.
-
-
Click Add.
Repeat these steps for each category you need. After you have created the category, you can add values to it.
Important
If no values are created for a category, you are unable to assign a value from that category nor be able to filter by that category.
Deleting a Tag Category
To delete a tag category:
-
Browse to Settings > Application Settings.
-
Click on the Settings accordion, then Region.
-
Select the Tags tab, then click on the My Company Categories tab.
-
Click Delete under the Actions column for the category you want to delete.
-
Click OK to confirm.
Note:
When you delete a tag category, the category values are removed, and any tags from the category are unassigned from all resources.
Creating a Company Tag
To create a company tag:
-
Browse to Settings > Application Settings.
-
Click on the Settings accordion, then Region.
-
Select the Tags tab, then click on the My Company Tags tab.
-
In the Choose a Category area, select a category from the Category list.
Note:
-
Some categories only allow one value to be assigned to a resource.
-
For some databases such as PostgreSQL, tags are case sensitive. For example, filtering by ‘Linux’ in title case give you different results from filtering by ‘linux’ in lower case.
-
-
Click Add under the Actions column, and type a Name and Description for your new value.
-
Click Add once again to add the new entry to the table.
Deleting a Company Tag
To delete a company tag:
-
Browse to Settings > Application Settings.
-
Click on the Settings accordion, then Region.
-
Select the Tags tab, then click on the My Company Tags tab.
-
Click Delete under the Actions column next to the tag to delete it.
Note:
When you delete a tag, the tag is also deleted from any resource to which it was assigned.
-
Click OK to confirm.
Importing Tags for Virtual Machines
You can import a CSV file with tag assignments into the VMDB. For the import to be successful, be aware of the following:
-
The file must be in the following format, with one line for each virtual machine. One virtual machine per tag must be on a separate line even if you are assigning multiple tags of the same category.
-
You must use the display names of the category and the display name for the tag for the import to work.
name,category,entry
evm2,Provisioning Scope,All
evm2,Exclusions,Do not Analyze
evm2,EVM Operations,Analysis Successful
rhel6,Department,Presales
rhel6,Department,Support
Importing Tags for a Virtual Machine from a CSV File
To import tags for a virtual machine from a CSV file:
- Make sure the CSV file is in the required format.
- Browse to Settings > Application Settings.
- Click on the Settings accordion, then Region.
-
Select the Tags tab, then click on the Import Tags tab.
-
Click Choose file to go to the location where the file is located.
-
Click Upload.
Note:
If there are any problems with the file, such as an incorrect column name, unknown virtual machine, unknown tag, or multiple values for a tag that should have only one, an error message will appear in the console for those records.
- Click Apply.
Importing Custom Values for Virtual Machines and Hosts
You can import a CSV file with asset tag information into the VMDB for a virtual machine or import custom values for hosts. For the import to be successful, the file must be in the following format, with one line for each virtual machine or host.
-
There are two columns.
-
The first line of the file must have the column names as shown below.
-
The column names are case sensitive.
-
Each value must be separated by a comma.
Virtual Machine Import Example
name,custom_1
Ecommerce,665432
Customer,883452
SQLSrvr,1090430
Firewall,8230500
For virtual machines, the value for custom_1 will show in the VM Summary page as the Custom Identifier page as the Custom Identifier in the Properties area. All of the custom values will show in the Custom Fields area.
Host Import Example
hostname,custom_1,custom_2
esx303.galaxy.local,15557814,19948399
esxd1.galaxy.local,10885574,16416993
esxd2.galaxy.local,16199125,16569419
For hosts, the value for custom_1 will show in the Host Summary page as the Custom Identifier in the Properties area. All of the custom values will show in the Custom Fields area.
Importing Asset Tags for a Virtual Machine from a CSV File
To import asset tags for a virtual machine from a CSV file
- Make sure the CSV file is in the required format.
- Browse to Settings > Application Settings.
- Click on the Settings accordion, then Region.
- Select the Tags tab, then click on the Import Variables tab.
-
Select the type of custom variable you want to import, either Host or VM.
-
Click Choose file to go to the location where the custom variable file is located.
-
Click Upload.
Note:
If there are any problems with the file, such as an incorrect column name, unknown virtual machine or host, a message appears.
- Click Apply.
Tag Mapping
You can map labels from external providers to tags within ManageIQ.
- Browse to Settings > Application Settings.
- Click on the Settings accordion, then select the Region.
- Select the Tags tab, then click on the Map Tags tab.
- Click Add to create a tag map.
- In the Choose a resource entity and label, select the Entity and enter a Resource label, then enter a Tag Category.
- Click Add.
Customizing the Help Menu
ManageIQ allows administrators to customize the help menu. Use this feature to define menu labels, URLs and how each window opens for users.
Note:
Any change to the help menu will take effect upon a full page reload.
Customize the help menu using the following steps:
- Browse to Settings > Application Settings.
- Click on the Settings accordion, then Region.
- Click on the Help Menu tab.
-
Provide custom Menu item labels and an associated URL for each. Define how each window should open by selecting from the options in the Open in menu.
- Click Submit.
Profiles
Creating an Analysis Profile
You can create an analysis profile by referring to the sample profiles provided in the console. You can copy the sample profile or create a new one.
Creating a Host Analysis Profile
To create a host analysis profile:
- Browse to Settings > Application Settings.
-
Click on the Settings accordion, then click Analysis Profiles.
-
Click Configuration, and
(Add Host Analysis Profile). -
In the Basic Information area, type in a Name and Description for the analysis profile.
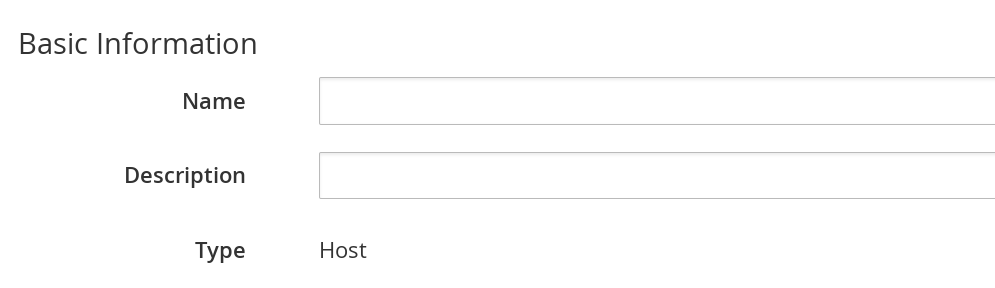
-
Click File to collect information about a file or group of files.
-
From the File Entry area, click
(Click to add a new entry) to add a file or group of files. 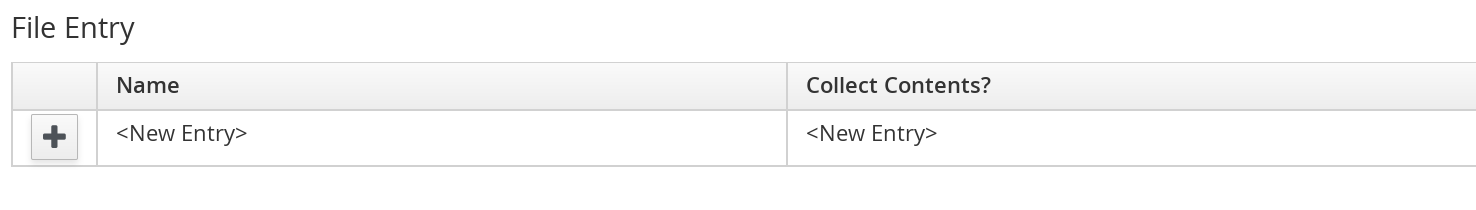
- Check Collect Contents to not only check for existence, but also gather the contents of the file. If you do this, then you can use the contents to create policies in ManageIQ Control.
-
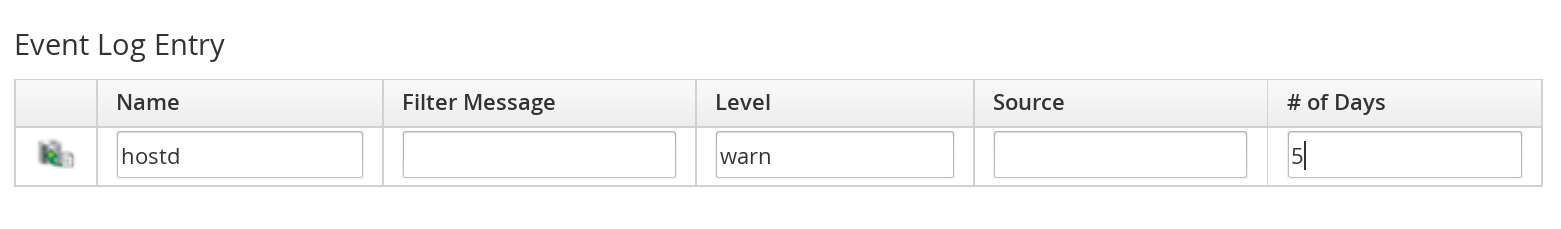
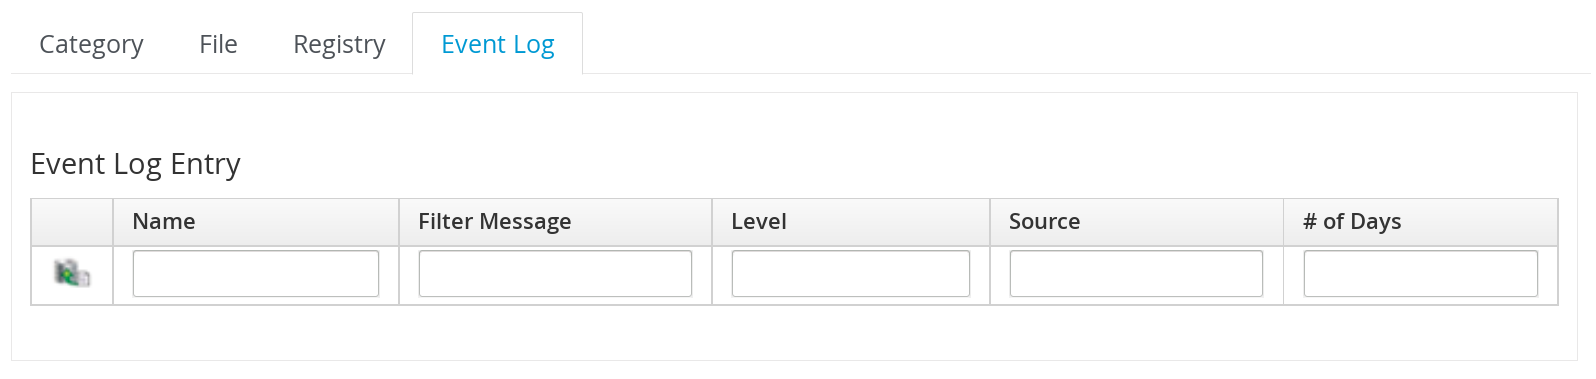
Click Event Log to specify event log entries to collect.
-
From the Event Log Entry area, click
Click to add a new entry to add a type of event log entry. Type in a Name. You can type in a specific message to find in Filter Message. In Level, set the value for the level of the entry and above. Specify the Source for the entry. Finally, set the # number of days that you want to collect event log entries for. If you set this to 0, it will go as far back as there is data available.
- Click Add.
Creating a Virtual Machine Analysis Profile
To create a virtual machine analysis profile:
- Browse to Settings > Application Settings.
-
Click on the Settings accordion, then click Analysis Profiles.
-
Click Configuration, and
Add VM Analysis Profile. -
In the Basic Information area, type in a Name and Description for the analysis profile.
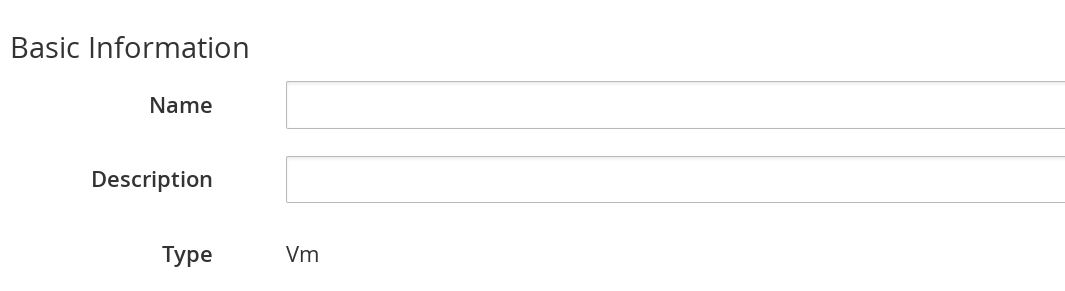
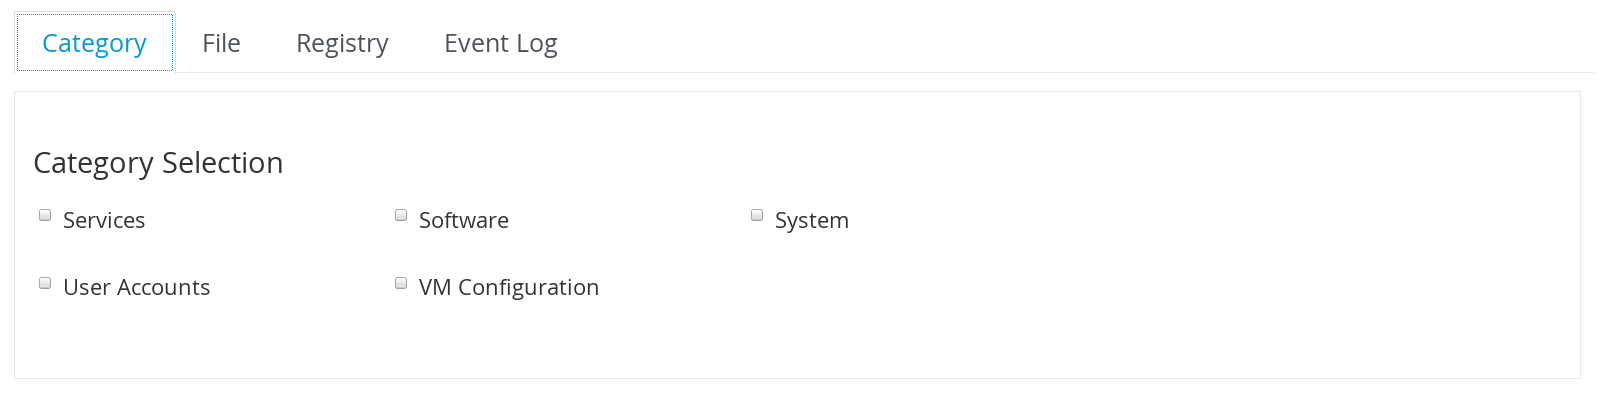
-
You begin in the Category tab. From the Category Selection area, check the categories you want to collect information for. This is available for virtual machine profiles only.
-
Click the File tab to collect information about a file or group of files.
-
From the File Entry area, click
Add this entry to add a file or group of files, then type a name. For virtual machines, specify the file to check for. Check the box under Collect Contents if you want to collect the file contents as well. The files can be no larger than 1 MB. 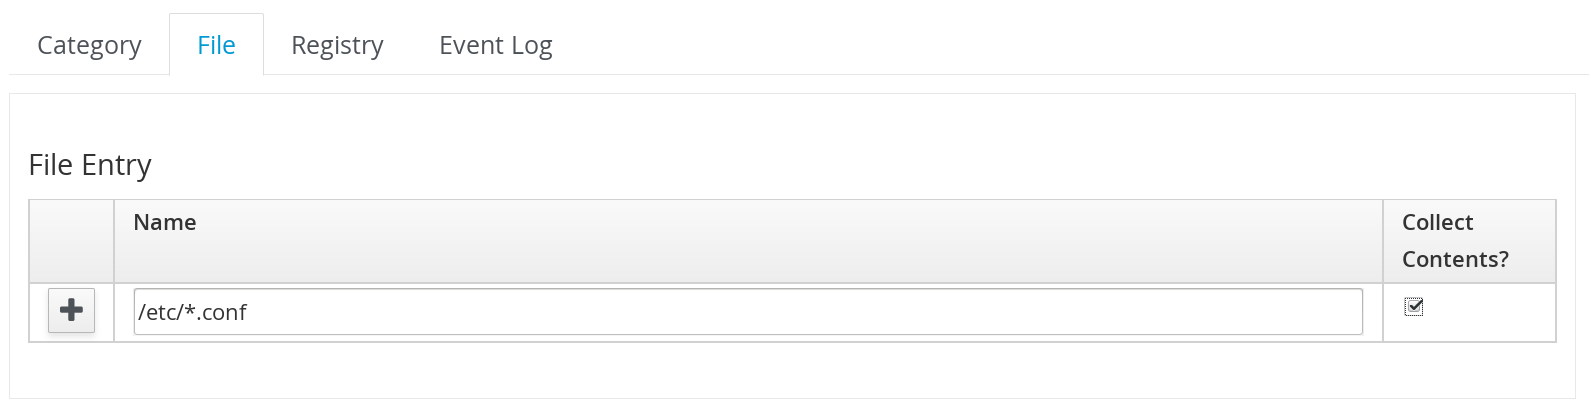
-
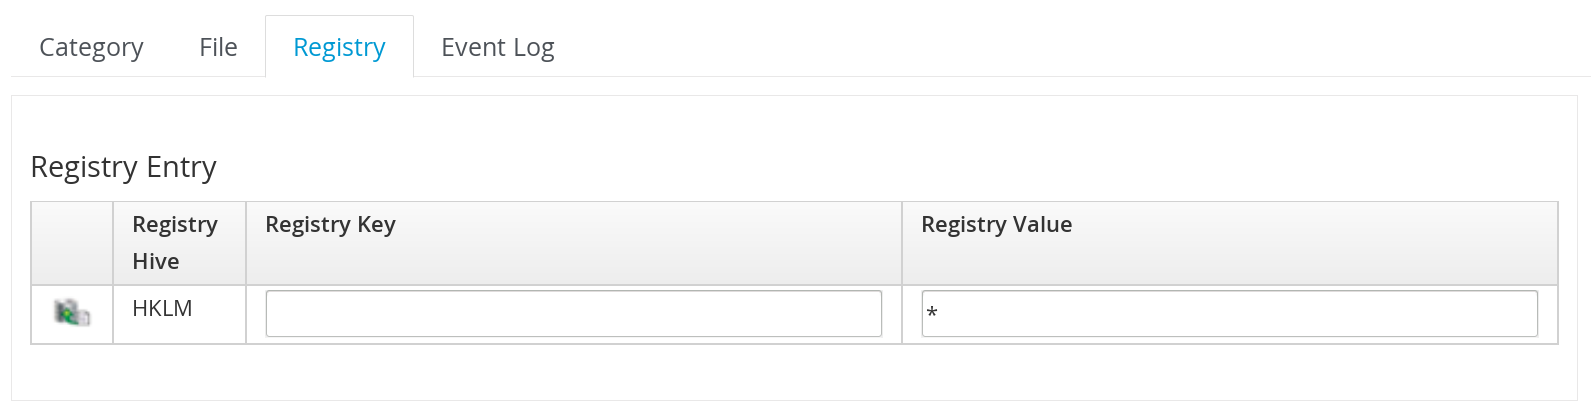
Click the Registry tab to collect information on a registry key.
-
From the Registry Entry area, type your Registry Key and Registry Value. To evaluate whether a registry key exists or does not exist on a virtual machine, without providing a value, type * in the Registry Value field. Then, you do not need to know the registry value to collect the keys. This is available for virtual machine profiles only.
-
Click Event Log to specify event log entries to collect.
-
From the Event Log Entry area, complete the fields to add a type of event log entry. You can type in a specific message to find in Filter Message. In Level, set the value for the level of the entry and above. Specify the Source for the entry. Finally, set the # (number) of days that you want to collect event log entries for. If you set this to 0, it will go as far back as there is data available.
- Click Add.
Editing an Analysis Profile
To edit an analysis profile:
- Browse to Settings > Application Settings.
- Click on the Settings accordion, then click Analysis Profiles.
-
Check the analysis profile you want to edit.
-
Click
Edit the selected Analysis Profiles. -
Make any changes.
- Click Save.
The changes are added to the analysis profile. The virtual machines or hosts must be re-analyzed to collect the new or modified information.
Copying an Analysis Profile
To copy an analysis profile:
- Browse to Settings > Application Settings.
-
Click on the Settings accordion, then click Analysis Profiles.
-
Check the analysis profile you want to copy.
-
Click Configuration, then
Copy the selected Analysis Profiles. -
Type a new Name and Description.
-
Make required changes.
- Click Add.
Setting a Default Analysis Profile
If you want to set an analysis profile to be used for all virtual machines, you can create a default profile.
To create a default analysis profile:
- Browse to Settings > Application Settings.
-
Click on the Settings accordion, then click Analysis Profiles.
-
Click on the analysis profile you want to set as the default.
-
Click Configuration, then
Edit the selected Analysis Profile. -
For a virtual machine profile, enter
defaultin lower case in Name. For a host profile, enterhost default.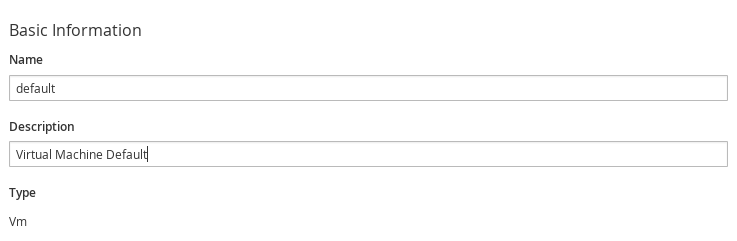
- Click Save.
Zones
You can organize your ManageIQ Infrastructure into zones to configure failover and isolate traffic. A provider that is discovered by a server in a specific zone gets monitored and managed in that zone. All jobs, such as a SmartState Analysis or VM power operation, dispatched by a server in a specific zone can get processed by any ManageIQ appliance assigned to that same zone.
Zones can be created based on your own environment. You can make zones based on geographic location, network location, or function. When first started, a new server is put into the default zone.
Suppose you have four ManageIQ appliances with two in the East zone, appliances A and B, and two in the West zone, appliances C and D. VC East is discovered by one of the ManageIQ appliances in the ManageIQ Eastern zone. If Appliance A dispatches a job of analyzing twenty virtual machines, this job can be processed by either Appliance A or B, but not C or D.
Note:
Only users assigned the super administrator role can create zones. There must always be at least one zone. The Default Zone is provided and cannot be deleted.
Creating a Zone
To create a zone:
- Browse to Settings > Application Settings.
-
Click on the Settings accordion, then click Zones.
-
Click Configuration, and
Add a new Zone to create a zone. -
In the Zone Information area, type in a Name and Description for the new zone.
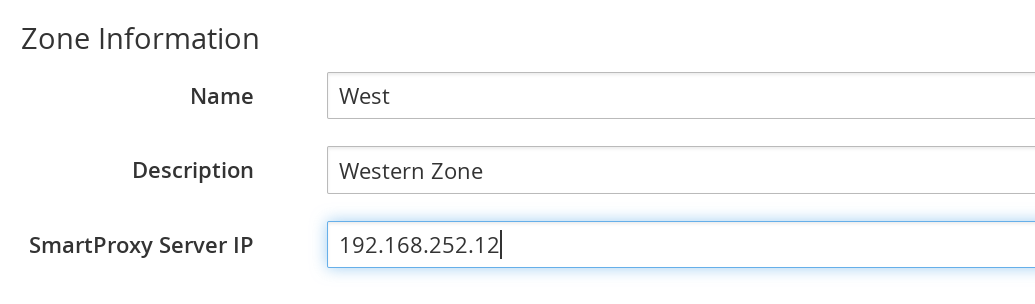
-
Use SmartProxy Server IP to specify the IP address of the server that you want SmartProxies installed in this zone to report to. If this is not set, then the IP address of the server that deployed the SmartProxy is used. This does not apply to embedded SmartProxies.
-
Optionally, you can configure NTP servers for the entire zone in the NTP Servers area. These settings will be used if the NTP servers have not been set for the appliance in the menu: Operations > Server page.
-
In the Settings area, set the number for Max Active VM Scans. The default is
Unlimited. - Click Save.
Deleting a Zone
To delete a zone:
- Browse to Settings > Application Settings.
-
Click on the Settings accordion, then click Zones.
-
Click the zone you want to remove.
Note:
You cannot delete a zone if there are servers assigned to it.
-
Click
 Configuration, then click
Delete this Zone.
Configuration, then click
Delete this Zone. - Click OK to confirm.
Editing a Zone
To edit a zone:
- Browse to Settings > Application Settings.
- Click on the Settings accordion, then click Zones.
-
Click the zone you want to edit.
-
Click
Configuration, then click
Edit this Zone. -
Complete the required changes.
- Click Save.
Adding SmartProxy Affinity to a Zone:
Enable SmartProxy Affinity for zones containing servers with the SmartProxy role to run a SmartState Analysis.
To add SmartProxy Affinity to a zone:
- Browse to Settings > Application Settings.
- Click on the Settings accordion, then click Zones.
- Click the zone in which you want to enable SmartProxy Affinity.
- Click the SmartProxy Affinity tab and click the appropriate server.
- Click Save.
Servers
Server settings enables you to control how each ManageIQ server operates including authentication, logging, and email. If you have multiple servers in your environment that are reporting to one central VMDB, then you can edit some of these settings from the console by specifying which server you want to change.
Note:
The server selection options are only available if you have multiple servers sharing one VMDB.
Changing Server Settings
To change server settings:
- Browse to Settings > Application Settings.
- Click on the Settings accordion, then click Zones.
-
Click the zone where the ManageIQ server is located.
-
In the Servers area, click on the ManageIQ server.
-
Click Server.
-
Make any required changes.
- Click Save.
Basic Information Settings 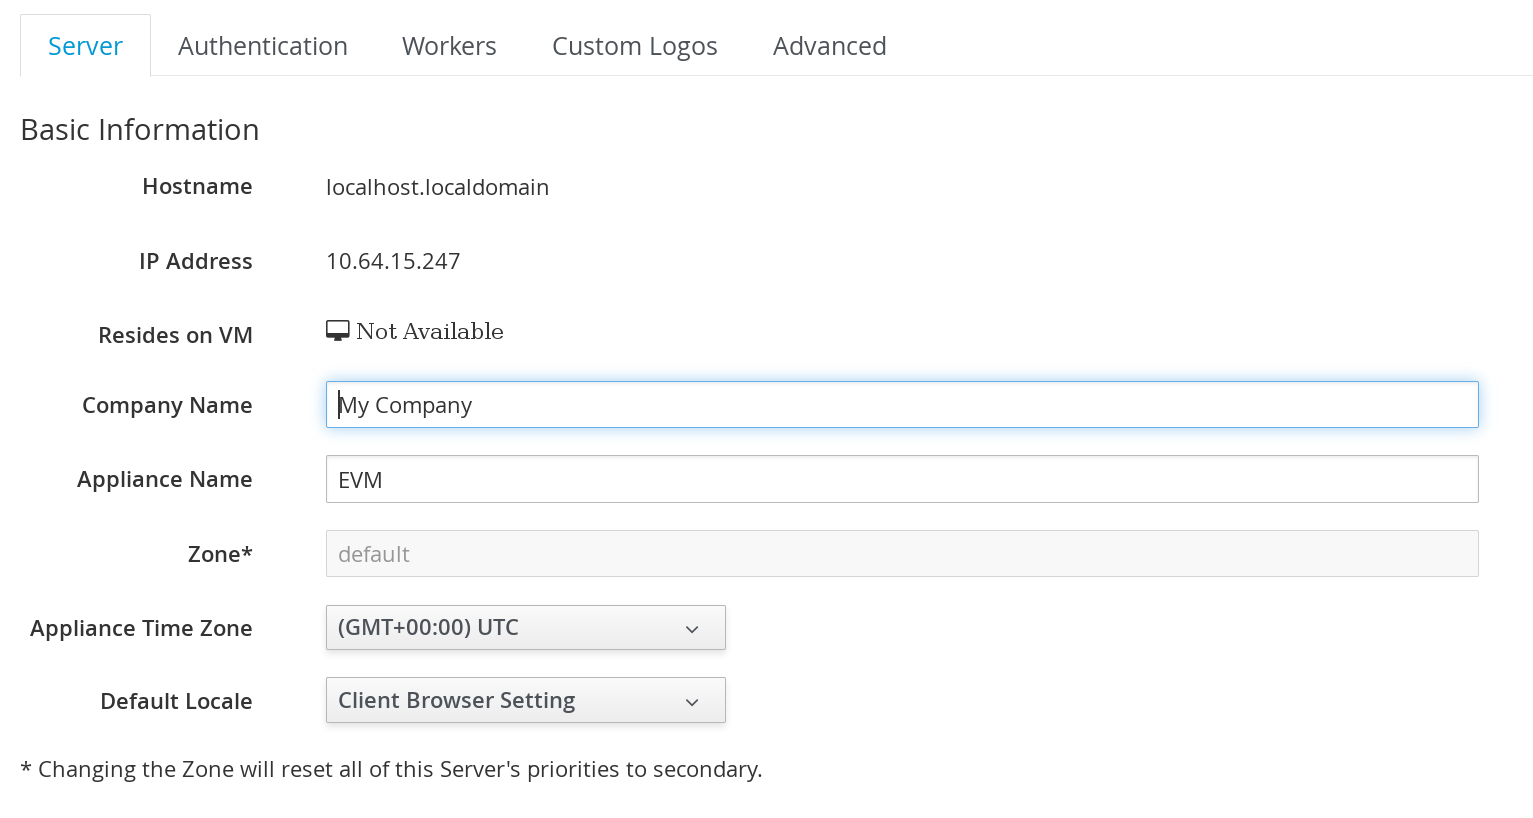
-
There is no longer a Company Name field here. Use the root Tenant’s name to customize the interface with your company’s name. You will see the company name when you are viewing or modifying the tags of an infrastructure object or virtual machine.
-
Specify the Appliance Name (maximum 20 characters) you want displayed as the appliance that you are logged into. You will see this in the upper right corner of the interface with the name of the consoles logged on user.
-
Use Zone to isolate traffic and provide load balancing capabilities. Specify the zone that you want this ManageIQ appliance to be a member of. At startup, the zone is set to default.
-
Use Appliance Time Zone to set the time zone for this server.
Note:
This is the time zone used when created scheduled analyses. This is not the same as the Time Zone parameter, which is found by navigating to the settings menu, then My Settings, then exploring the Display Settings area, and is the time zone displayed in the console.
-
Use Default Locale to specify the default language for this server.
Server Control Settings
A server role defines what a server can do. Database Operations, Event Monitor, Reporting, Scheduler, SmartState Analysis, User Interface, Provider Inventory, Provider Operations, and Web Services are recommended on at least one server in each zone. These roles are enabled by default on all servers.
- Use Default Repository SmartProxy to set the SmartProxy from which you refresh your virtual machine repositories. This host must have access to your repositories to analyze its virtual machines.
Note:
-
Only super administrators can change server roles.
-
If you are using more than one ManageIQ appliance, be sure to set this on all of the appliances.
Server Roles
Note:
-
Server roles that are in an active/active high availability configuration (load balancing and failover protection) are active in more than one location; whereas, roles that are in an active/passive (primary/secondary in the case of ManageIQ) high availability configuration (failover protection), if more than one ManageIQ server in a specific zone or region has this role, only one will be active (primary) at a time and a failover has to occur to the passive (secondary) appliance with that role.
-
For information on region and zone diagnostics and server role priorities, see Diagnostics.
| Server Role | Description | Zone or Region Aware | Primary/Secondary or Active/Active |
|---|---|---|---|
| Automation Engine | Use this role if you want to use this ManageIQ server to process automation tasks. | N/A | Active/Active |
| Capacity and Utilization Coordinator | The Capacity & Utilization Coordinator role checks to see if it is time to collect data, somewhat like a scheduler. If it is time, a job is queued for the Capacity and Utilization Data Collector. The coordinator role is required to complete Capacity and Utilization data collection. If more than one ManageIQ server in a specific zone has this role, only one will be active at a time. | Zone | Primary/Secondary |
| Capacity & Utilization Data Collector | The Capacity & Utilization Data Collector performs the actual collection of capacity and utilization data. This role has a dedicated worker, and there can be more than one ManageIQ server with this role in a zone. | Zone | Active/Active |
| Capacity & Utilization Data Processor | The Capacity & Utilization Data Processor processes all of the data collected, allowing ManageIQ to create charts. This role has a dedicated worker, and there can be more than one ManageIQ server with this role in a zone. | Zone | Active/Active |
| Database Operations | Use Database Operations to enable this ManageIQ server to run database backups or garbage collection. | Zone | Active/Active |
| Embedded Ansible | This role is disabled by default. The Embedded Ansible role supports Ansible Automation Inside functionality. Enable this role to configure playbook repositories and run playbooks natively to back service catalog items. NOTE: Enable the Provider Inventory server role in the same zone as the Embedded Ansible server role to ensure proper functionality. | Region | Primary/Secondary |
| Event Monitor | This role is enabled by default and provides the information shown in timelines. The Event Monitor is responsible for the work between the ManageIQ server and your providers. It starts 2 workers for each provider. One worker, the monitor, is responsible for maintaining a connection to a provider, catching events, and putting them on the ManageIQ message queue for processing. The second worker, the handler, is a message queue worker responsible for delivering only those messages for a provider. You should have at least one of these in each zone. | Zone | Primary/Secondary |
| Git Repository | The Git Repositories Owner server role supports importing domains into automate from a git repository. This feature is available from the Automate > Import/Export screen in the ManageIQ user interface. | Region | Primary/Secondary |
| Notifier | Use this role if you will be using ManageIQ Control or Automate to forward SNMP traps to a monitoring system or send e-mails. See Creating an Alert for details on creating SNMP alerts. If more than one ManageIQ server in a specific region has this role, only one will be active at a time. | Region | Primary/Secondary |
| Provider Inventory | This role is enabled by default. This role is responsible for refreshing provider information including EMS, hosts, virtual machines, and clusters, and is also responsible for capturing datastore file lists. If more than one ManageIQ server in a specific zone has this role, only one will be active at a time. Required in the same zone as a ManageIQ appliance with the Embedded Ansible role enabled. | Zone | Primary/Secondary |
| Provider Operations | This role is enabled by default. This role sends stop, start, suspend, shutdown guest, clone, reconfigure, and unregister to the provider, directly from the console or through a policy action if you have ManageIQ Control. More than one ManageIQ server can have this role in a zone. | Zone | Active/Active |
| RHN Mirror | An appliance with RHN Mirror enabled acts as a server containing a repository with the latest ManageIQ packages. This also configures other appliances within the same region to point to the chosen RHN Mirror server for updates. This provides a low bandwidth method to update environments with multiple appliances. | N/A | Active/Active |
| Reporting | This role is enabled by default. The Reporting role specifies which ManageIQ servers can generate reports. If you do not have a ManageIQ server set to this role in a zone, then no reports can be generated in that zone. You should have at least one of these in each zone. | Zone | Active/Active |
| Scheduler | This role is enabled by default. The Scheduler sends messages to start all scheduled activities such as report generation and SmartState analysis. This role also controls all system schedules such as capacity and utilization data gathering. One server in each region must be assigned this role or scheduled ManageIQ events will not occur. If more than one ManageIQ server in a specific region has this role, only one will be active at a time. | Region | Primary/Secondary |
| SmartProxy | Enabling the SmartProxy role turns on the embedded SmartProxy on the ManageIQ server. The embedded SmartProxy can analyze virtual machines that are registered to a host and templates that are associated with a provider. To provide visibility to repositories, install the SmartProxy on a host from the ManageIQ console. This SmartProxy can also analyze virtual machines on the host on which it is installed. Enabling the SmartProxy role on an appliance requires selecting the SmartProxy Affinity for a zone to run a SmartState Analysis. By default, no selections are enabled under SmartProxy Affinity. | Zone | Active/Active |
| SmartState Analysis | This role is enabled by default. The SmartState Analysis role controls which ManageIQ servers can control SmartState Analyses and process the data from the analysis. You should have at least one of these in each zone. | Zone | Active/Active |
| User Interface | This role is enabled by default. The Web Services role must also be enabled with this role to log into the user interface, as the User Interface role queries the API to receive tokens for login. Uncheck User Interface if you do not want users to be able to access this ManageIQ server using the ManageIQ console. For example, you may want to turn this off if the ManageIQ server is strictly being used for capacity and utilization or reporting generation. More than one ManageIQ server can have this role in a zone. | Zone | Active/Active |
| Web Services | This role is enabled by default. The Web Services roles provides API access and must be enabled if the User Interface role is enabled to log into the user interface. You can also enable the Web Services role to provide API-only access to the server. Uncheck Web Services to stop this ManageIQ server from acting as a web service provider. More than one ManageIQ server can have this role in a zone. | N/A | Active/Active |
| Websocket | This role enables starting or stopping websocket workers required for proxying remote consoles. | N/A | Active/Active |
VMware Console Settings
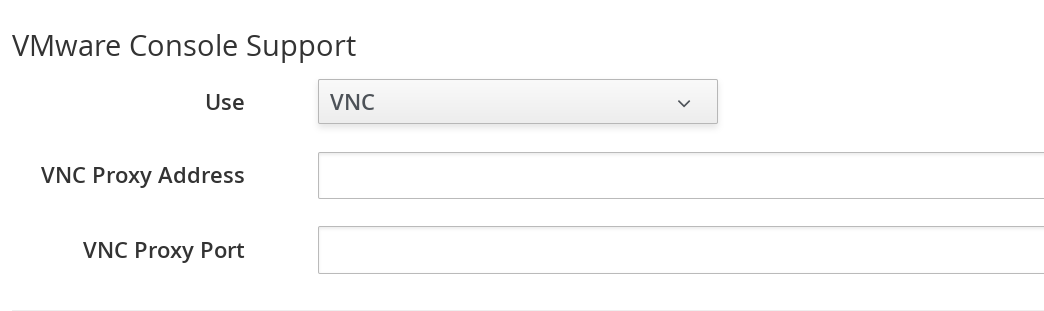
If you are using the ManageIQ control feature set, then you have the ability to connect to a Web console for virtual machines that are registered to a host. To use this feature, you must have VNC installed, VMware’s WebMKS SDK enabled in ManageIQ, or the VMRC native desktop application installed for your environment.
Note:
See vendor documentation to ensure you are installing appropriate applications for your virtual infrastructure. Once you have installed the required software, you must specify its version in the ManageIQ configuration settings.
-
If you select VNC, type in the port number used. This port must be open on the target virtual machine and the VNC software must be installed there. On the computer that you are running the console from, you must install the appropriate version of Java Runtime if it is not already installed.
-
If you select VMware WebMKS, select the appropriate version.
-
If using VMware VMRC desktop application, be sure that you have fulfilled the requirements for your vCenter version. The correct version of the VMRC desktop application from VMware must be installed on the client computer. To do this, log into the vCenter Web Service and attempt to open a virtual machine console. The vSphere Web Client must be installed on vCenter version 5, and the provider must be registered to it. For vCenter version 4, the VMware vCenter Management Webservices must be running.
NTP Servers Settings
In the NTP Servers area, you can specify the NTP servers to use as source for clock synchronization here. The NTP settings specified here will override Zone NTP settings. Enter one NTP server hostname or IP address in each text box.
Configuring SNMP
You can use Simple Network Management Protocol (SNMP) traps to send alerts for various aspects of a ManageIQ environment.
Requirements
-
Configure your SNMP management station to accept traps from ManageIQ appliances. Consult your management station’s documentation.
-
Each appliance that could process SNMP traps must have the
snmpdandsnmptrapddaemons running. -
The region where the appliances are located must have the
Notifierrole enabled and the failover role priority set.
To enable the snmpd and snmptrapd daemons
-
Access each SNMP processing appliance using SSH.
-
Set the SNMP daemons to run on start up:
# chkconfig --level 2345 snmpd on # chkconfig --level 2345 snmptrapd on -
The daemons run automatically when the appliance is restarted, but must be started manually now.
# service snmpd start
# service snmptrapd start
To enable the notifier role:
-
Access each SNMP processing appliance using their web interfaces.
-
Browse to Settings > Application Settings.
-
Click on the Settings accordion, then click Zones. Select the zone where the EVM server is located, and select the EVM server.
-
In the Server Control area, set the Notifier server role option to
ON. -
Click Save.
To set the failover priority role:
-
Browse to Settings > Application Settings then click the Diagnostics accordion.
-
Select the zone where the EVM server is located.
-
Click Roles by Servers or Servers by Roles to view your servers.
-
In the Status of Roles for Servers in Zone Default Zone area, click the role that you want to set the priority for.
-
Click Configuration, and
 Promote Server to make this the primary server for this role.
Outgoing SMTP Email Settings
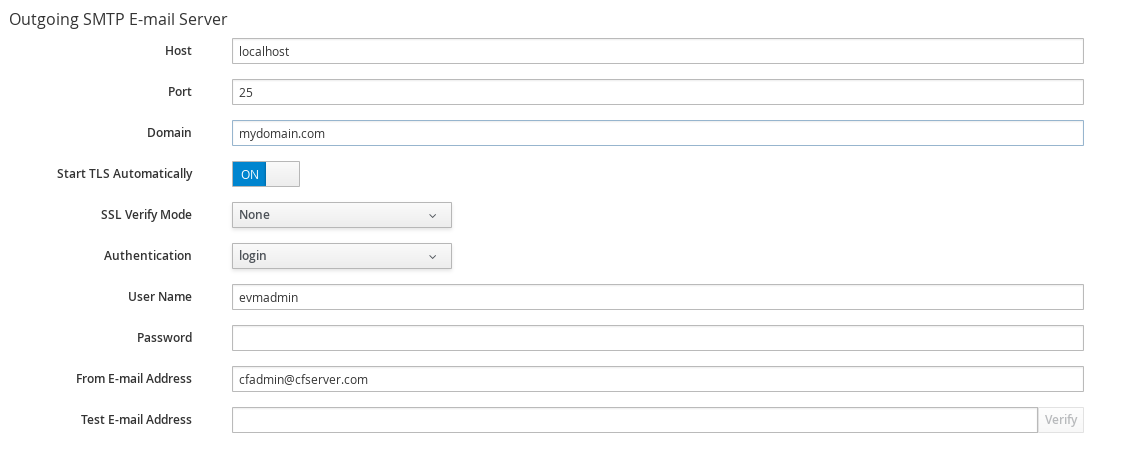
To use the email action in ManageIQ, set an email address to send emails from.
Note:
To be able to send any emails from the server, you must have the Notifier server role enabled. You can test the settings without the role enabled.
-
Use Host to specify the host name of the mail server.
-
Use Port to specify the port for the mail server.
-
Use Domain to specify the domain name for the mail server.
-
Set Start TLS Automatically on
ONif the mail server requires TLS. -
Select the appropriate SSL Verify Mode.
-
Use the Authentication drop down to specify if you want to use
login,plain, or no authentication. -
Use User Name to specify the user name required for login authentication.
-
Use Password to specify the password for login authentication.
-
Use From E-mail Address to set the address you want to send the email from.
-
Use Test E-mail Address if you want to test your email settings. Click Verify to send a test email.
Web Services Settings
Web services are used by the server to communicate with the SmartProxy.

-
Set Mode to invoke to enable 2-way Web services communication between the ManageIQ appliance and the SmartProxy. Set Mode to disabled to use Web services from the SmartProxy to the ManageIQ appliance only. When the ManageIQ appliance has work for the SmartProxy, the work will be placed in a queue in the VMDB. The work will be completed either when the ManageIQ appliance is able to contact the SmartProxy or when the next SmartProxy heartbeat occurs, whichever comes first.
-
If Web Services are enabled, you have the option to use ws-security.
Logging Settings
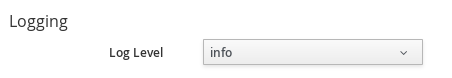
- Use Log Level to set the level of detail you want in the log. You can select from fatal, error, warn, info, and debug. The default setting is ‘info’.
Custom Support URL Settings
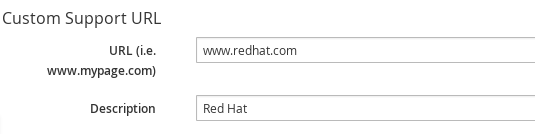
-
Use URL to specify a specific URL that you want to be accessible from the About Product Assistance area.
-
Use Description to set a label for the URL.
Authentication
Use the Authentication tab to specify how you want users authenticated on the console. You can use the VMDB or integrate with LDAP, LDAPS, Amazon, or an external IPA server.
Changing Authentication Settings
To change authentication settings:
-
Browse to Settings > Application Settings.
-
Click the Settings accordion, then click Zones.
-
Click the zone where the server is located.
-
Click the server.
-
Click the Authentication tab.
-
Use Session Timeout to set the period of inactivity before a user is logged out of the console.
-
Set the authentication method in Mode.
-
Click Save.
Workers
Use the Workers page to specify the number of workers and amount of memory allowed to be used for each type.
Note:
Only make these changes when directed by Support.
Changing Settings for a Worker
To change the settings for a worker
-
Browse to Settings > Application Settings.
-
Click on the Settings accordion, then click Zones.
-
Click the zone where the server is located.
-
Click on the server.
-
Click Workers.
-
Go to the type of worker you have been directed to change.
-
If applicable, change Count or Memory Threshold using the dropdown boxes.
-
Click Save.
Database
Use the Database page to specify the location of your Virtual Machine Database (VMDB) and its login credentials. By default, the type is PostgreSQL on the Server.
Note:
The server may not start if the database settings are changed. Be sure to validate your new settings before restarting the server.
Changing a Database Setting
To change a database setting:
-
Browse to Settings > Application Settings.
-
Click on the Settings accordion, then click Zones.
-
Click the zone where the server is located.
-
Click on the server.
-
Click the Database tab.
-
In the Database area, select the Type of database. You can select from External Database on another CFME appliance, External Postgres Database, and Internal Database on this CFME Appliance.
-
Use Hostname to specify the IP address or hostname of the external database server.
-
Use Database Name to specify the name of your VMDB.
-
Specify the User Name to connect to the VMDB.
-
Use Password and Verify Password to specify the password for the user name.
-
-
Click Validate to check the settings.
-
Click Save.
-
Click OK to the warning that the server will restart immediately after you save the changes.
During the restart, you are unable to access the server. When the restart is complete, the new database settings are in effect.
Customization and Logos
Custom Logos
Use Custom Logos to display your own logo in the corner of the ManageIQ user interface and on the login screen. Use the procedures below to upload a custom logo to the user interface, and to customize the login background and login panel text on the user interface.
Note:
-
If you have upgraded from an earlier ManageIQ version and your custom logo was already in use before migration, although your logo image file is still in place in
vmdb/public/uploadyou may have to uncheck and recheck the option to Use Custom Logo Image to re-enable displaying your custom logo. See Uploading a Custom Logo to the User Interface for the procedure on how to access the Use Custom Logo Image option, or if you want to upload another custom logo to the user interface and customize the login background image and login panel text. -
Additionally, ensure the option to use configuration settings for the tenant under Access Control is set to
Yes; see Displaying the Custom Configuration Settings for the procedure on how to set the configuration settings.
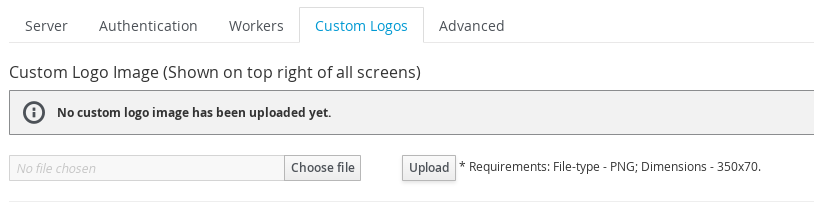
Uploading a Custom Logo to the User Interface
Note:
Make sure the desired logo is accessible from the computer where you are running the ManageIQ user interface. The file must be in portable network graphics (png) format with dimensions of 350 px x 70 px.
To upload a custom logo to the user interface:
-
Browse to Settings > Application Settings.
-
Click on the Settings accordion, then click Zones.
-
Click the zone where the ManageIQ server is located.
-
Click on the server.
-
Click the Custom Logos tab.
-
In Custom Logo Image (Shown on top right of all screens), click Choose file to go to the location where the logo file is located.
-
Click Upload. The icon is displayed above the file name box, and an option is shown to use the logo.
-
Check Use Custom Logo Image to add the logo to your user interface.
-
Click Save.
Note:
To enable displaying your custom logo, ensure the option to use
configuration settings for the tenant under Access Control is set to
Yes. See Displaying the Custom Configuration Settings for the procedure
on how to set the configuration settings.
Customizing the Login Background
Note:
Make sure the background image that you want to use is accessible from the computer where you are running the user interface. The file must be in PNG format with dimensions of 1280 px x 1000 px.
To customize the login background:
-
Browse to Settings > Application Settings.
-
Click on the Settings accordion, then click Zones.
-
Click the zone where the server is located.
-
Click on the server.
-
Click the Custom Logos tab.
-
In Custom Login & ‘About’ Screen Background Image, click Choose file to go to the location where the background image file is located.
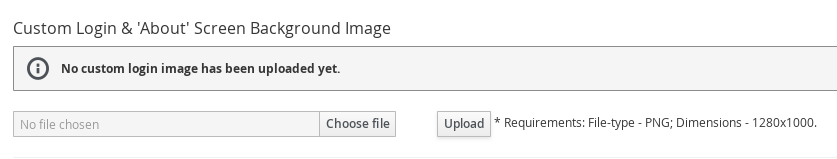
-
Click Upload. The icon is displayed above the file name box, and an option is shown to use the logo.
-
Check Use Custom Login Background Image to add the background image to the login screen of the user interface.
-
Click Save.
Customizing the Login Panel Text
To customize the login panel text:
-
Browse to Settings > Application Settings.
-
Click on the Settings accordion, then click Zones.
-
Click the zone where the server is located.
-
Click on the server.
-
Click the Custom Logos tab.
-
In Custom Login Panel Text, enter the text that you want to display on the login screen.
-
Click Use Custom Login Text to switch it to
Yes.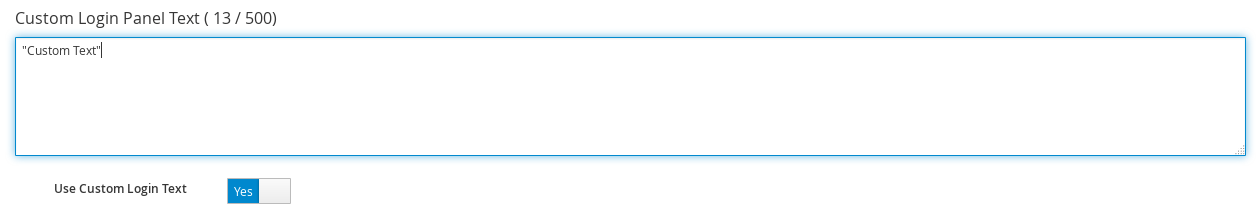
-
Click Save.
Displaying the Custom Configuration Settings
To enable displaying your custom logo in the corner of the ManageIQ user interface and on the login screen:
-
Browse to Settings > Application Settings.
-
Click the Access Control accordion.
-
Click Tenants, then click My Company.
-
Click
(Configuration), then click
(Edit this item).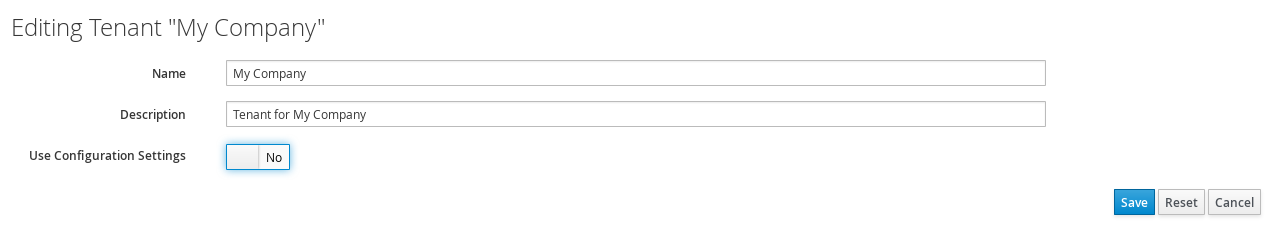
-
Click Use Configuration Settings to switch it to
Yes. -
Click Save.
Advanced Settings
You may be instructed by Support to edit some configuration settings manually. This feature is available for a limited number of options and can only be used by users assigned the super administrator role. Changing settings using this procedure may disable your ManageIQ server.
Editing Configuration Files Manually
To edit configuration files manually:
-
Click
Configuration. -
Click on the Settings accordion, then click Zones.
-
Click the zone where the server is located.
-
You can click the Advanced tab at the zone level to set advanced configuration settings for the entire zone. Or, you can click on the server, and then click the Advanced tab to set advanced configuration settings at the server (appliance) level, which will override zone-level settings.
-
Make the required changes to the configuration file.
-
Click Save.
Configuration Parameters
Table: authentication
| Parameters | Description |
|---|---|
| amazon_key | If using Amazon for the authentication mode, specify your Amazon Key. This is the same as Amazon Access Key in Configuration-Operations-Server-Amazon Settings in the appliance console. Default: blank |
| amazon_secret | If using Amazon for the authentication mode, specify your Amazon Secret. This is the same as Amazon Secret Key in Configuration-Operations-Server-Amazon Settings in the appliance console. Default: blank |
| basedn | If using ldap for the authentication mode, specify your Base DN. This is the same as Base DN in Configuration-Operations- Server-LDAP Settings in the appliance console. Default: blank |
| bind_dn | The user name to bind to the LDAP server. This user must have read access to all users and groups that will be used for ManageIQ authentication and role assignment. This is the same as Bind DN in Configuration-Operations-Server-LDAP Settings in the appliance console. Default: blank |
| bind_pwd: | The password for the bind_dn user. This is the same as Bind Password in Configuration-Operations- Server-LDAP Settings in the appliance console. Default: blank |
| get_direct_groups | Use this to get the LDAP roles from the LDAP users’ home forest. This is the same as Get Roles from Home Forest in the Authentication page for the ManageIQ Server. Default: true |
| group_memberships_max_depth | When traversing group memberships in the LDAP directory it will stop at this value. Default: 2 |
| ldaphost | Use ldaphost to specify the fully qualified domain name of your LDAP server. This is the same as LDAP Host Name in Configuration-Operations-Server-LDAP Settings in the appliance console. Default: blank |
| ldapport | Specify the port of your LDAP server. This is the same as LDAP Port in Configuration-Operations- Server-LDAP Settings in the appliance console. Default: 389 |
| mode | Use database to use the VMDB for security. Use ldap or ldaps to use directory services. This is the same as Mode in Configuration-Operations-Server-Authentication in the appliance console. Default: database |
| user_type | Use userprincipalname to type the user name in the format of user@domainname. Use mail to login with the user’s e-mail address. Use dn-cn for Distinguished Name (CN=<user>) or dn-uid Distinguished Name (UID=<user>) to use just the user name, but be sure to enter the proper user_suffix for either one. This is the same as User Type in Configuration-Operations- Server-LDAP Settings in the appliance console. Default: userprincipalname |
| user_suffix | Domain name to be used with user_type of dn-cn or dn-uid. This is the same as User Suffix in Configuration-Operations- Server-LDAP Settings in the appliance console. Default: blank |
Table: coresident_miqproxy
| Parameters | Description |
|---|---|
| use_vim_broker | Specify if you want the coresident SmartProxy to use a shared connection through the VIM broker to communicate with the VC or ESX host for SmartState Analysis. If it is disabled, then each SmartProxy SmartState Analysis would create its own connection. Default: true |
| concurrent_per_ems | Specify the number of co-resident SmartProxy SmartState Analyses that can be run against a specific management system at the same time. Default: 1 |
| concurrent_per_host | Specify the number of co-resident SmartProxy SmartState Analyses that can be run against a specific host at the same time. Default: 1 |
| scan_via_host | If you change scan_via_host to false, ManageIQ will use the Management System to scan which is limited by the concurrent_per_ems setting instead of the concurrent_per_host setting. Note this will greatly increase traffic to the Management System. Default: true |
Table: ems_refresh
| Parameters | Description |
|---|---|
| capture_vm_created_on_date | Set to false to turn off historical event retrieval. Set to true to turn on. By setting the flag to true ManageIQ will try to set the “ems_created_on” column in the vms table after an ems refresh for new VMs and any VMs with a nil “ems_created_on” value. ManageIQ looks at event information in our database as well as looking up historical event data from the management system. This is optional since the historical lookup could timeout. Default: false |
| collect_advanced_settings | Set to false if you do not want to collect advanced Virtual Machine settings during a management system refresh. This will increase the speed of the refresh, but less data will be collected. If the parameter is not listed, then the value is true. Default: true |
| ec2 | |
| get_private_images | For EC2 refreshes only; whether or not to retrieve private images. Default: true |
| get_public_images | For EC2 refreshes only; whether or not to retrieve public images. Default: false. Warning: setting get_public_images to true loads several thousand images in the VMDB by default and may cause performance issues. |
| get_shared_images | For EC2 refreshes only; whether or not to retrieve shared images. Default: true |
| public_images_filters | For EC2 refreshes only; a filter to reduce the number of public images. Default: all public images |
| ignore_terminated_instances | For EC2 refreshes only; whether or not to ignore terminated instances. Default: true |
| full_refresh_threshold | The number of targeted refreshes requested before they are rolled into a full refresh. For example, if the system and/or the user target a refresh against 7 VMs and 2 Hosts (9 targets), when the refresh actually occurs it will do a partial refresh against those 9 targets only. However, if a 10th had been added, the system would perform a full EMS refresh instead. Default: 100 |
| raise_vm_snapshot_complete_if_created_within: | Raises vm_snapshot_complete event for a snapshot being added to VMDB only if the create time in Virtual Center is within the configured period of time. This prevents raising events for old snapshots when a new VC is added to ManageIQ. Default: 15.minutes |
| refresh_interval | Scheduler does a periodic full EMS refresh every refresh_interval. Default: 24.hours |
Table: host_scan
| Parameters | Description |
|---|---|
| queue_timeout | Time period after which a host SmartState analysis will be considered timed out. Default: 20.minutes |
Table: log
| Parameters | Description |
|---|---|
| level | Specify the required level of logging for the ManageIQ appliance. Possible levels from most detailed to least detailed are: debug, info, warn, error, fatal. This is the same as Log Level in Configuration-Operations-Server-Logging in the appliance console and applies immediately to the evm log. Default: info |
| level_aws | Specify the level of logging for Amazon Web Services communications. Possible levels from most detailed to least detailed are: debug, info, warn, error, fatal. This applies to the aws log. Default: info |
| level_aws_in_evm | Specify what level of Amazon Web Services communication log should be also shown in evm log. Possible levels from most detailed to least detailed are: debug, info, warn, error, fatal. Default: error |
| level_fog | Specify the level of logging for Fog communications. Possible levels from most detailed to least detailed are: debug, info, warn, error, fatal. This applies to the fog log. Default: info |
| level_fog_in_evm | Specify what level of Fog communication log should be also shown in evm log. Possible levels from most detailed to least detailed are: debug, info, warn, error, fatal. Default: error |
| level_rails | Specify the level of logging for Rails. Possible levels from most detailed to least detailed are: debug, info, warn, error, fatal. Once changed, this applies immediately to the production log. Default: info |
| level_rhevm | Specify the level of logging for Red Hat communications. Possible levels from most detailed to least detailed are: debug, info, warn, error, fatal. This applies to the rhevm log. Default: warn |
| level_rhevm_in_evm | Specify what level of Red Hat communication log should be also shown in evm log. Possible levels from most detailed to least detailed are: debug, info, warn, error, fatal. Default: error |
| level_vim | Specify the level of logging for VIM (communication with VMware ESX and Virtual Center). Possible levels from most detailed to least detailed are: debug, info, warn, error, fatal. This applies to the vim log. Default: warn |
| level_vim_in_evm | Specify what level of vim logging should be also shown in the evm log. Possible levels from most detailed to least detailed are: debug, info, warn, error, fatal. Default: error |
Table: db_stats
| Parameters | Description |
|---|---|
| enabled | Specify if you want to keep track of the number of queries, size of queries, number of responses, size of response, min/max for each, number of established connections at for each server process. This information will show in the EVM log. Default: false |
| log_frequency | How frequently in seconds the process will log the database statistic in seconds. Default: 60 |
Table: callsites
| Parameters | Description |
|---|---|
| enabled | Specify if you want keep track of the code that is accessing the database. Enabling call sites will decrease performance because of the amount of information tracked. The db_stats: enabled parameter must be set to true to use this. Default: false |
| depth | Specify how many levels in the call stack to track for each database access. Default: 10 |
| min_threshold | Do not keep track of code that does not access the database this many times per log_frequency. Default: 10 |
| path | Set the path for the ManageIQ appliance log. This is the same as Log Path in Configuration-Operations- Server-Logging in the appliance console. Default: If no value is present, the path is /var/www/miq/vmdb/log. |
| line_limit | Limit how many characters are retained in a single log line. 0 means no limit. Default: 0 |
Table: collection
| Parameters | Description |
|---|---|
ping_depot |
Whether to use TCP port ping to the log depot before performing log collection. Default: true |
ping_depot_timeout |
Specify how long in seconds to wait for response from log depot before deciding that the TCP port ping failed. Default: 20 |
current |
When collecting logs, specifies what is considered current logging as opposed to archived logging. Default: :pattern: log/*.log log/apache/*.log log/*.txt config/* /var/lib/pgsql/data/*.conf /var/lib/pgsql/data/log/* /var/log/syslog* /var/log/daemon.log* /etc/default/ntp* /var/log/messages* /var/log/cron* BUILD GUID VERSION |
archive |
Specifies what is considered archived logging. The default pattern is blank which means *.gz files in the log directory. |
Table: log_depot
| Parameters | Description |
|---|---|
| uri | Specify the URI for the log depot. This is the same as the URI in Configuration > Diagnostics > Collect Logs in the appliance console. Default: blank |
| username | Specify the user name for the log depot. This is the same as the user ID in Configuration > Diagnostics > Collect Logs in the appliance console. Default: blank |
| password | Specify the password for the user for the log depot. This is the same as the password in Configuration > Diagnostics > Collect Logs in the appliance console. Default: blank |
Table: performance
| Parameters | Description |
|---|---|
| capture_threshold | |
| vm | Amount of time in minutes to wait after capture before capturing again. Default: 50.minutes |
| host | Amount of time in minutes to wait after capture before capturing again. Default: 50.minutes |
| ems_cluster | Amount of time in minutes to wait after capture before capturing again. Default: 50.minutes |
| storage | Amount of time in minutes to wait after capture before capturing again. Default: 120.minutes |
| capture_threshold_with_alerts | |
| host | Amount of time in minutes to wait after capture before capturing again. This value is used instead of capture_threshold for Hosts that have alerts assigned based on real time Capacity & Utilization data. Default: 20.minutes |
| ems_cluster | Amount of time in minutes to wait after capture before capturing again. This value is used instead of capture_threshold for clusters that have alerts assigned based on real time Capacity & Utilization data. Default: 50.minutes |
| vm | Amount of time in minutes to wait after capture before capturing again. This value is used instead of capture_threshold for VMs that have alerts assigned based on real time Capacity & Utilization data. Default: 20.minutes |
| concurrent_requests | |
| vm | Amount of time in minutes to wait after capture before capturing again. This value is used instead of capture_threshold for VMs that have alerts assigned based on real time Capacity & Utilization data. Default: 20.minutes |
| hourly | Number of concurrent VC requests to make when capturing hourly raw metrics. Default: 1 |
| realtime | Number of concurrent VC requests to make when capturing real time raw metrics. Default: 20 |
| history | |
| initial_capture_days | How many days to collect data for on first collection. Default: 0 |
| Keep_daily_performances | How long to keep daily performance data in the VMDB. Default: 6.months |
| keep_realtime_performances | How long to keep realtime performance data in the VMDB. Default: 4.hours |
| keep_hourly_performances | How long to keep hourly performance data in the VMDB. Default: 6.months |
| purge_window_size | When the purge needs to delete rows which are older than the keep_realtime_performances, keep_hourly_performances, and keep_daily_performances values, this value sets how many rows to delete in each batch. For example, a value of 1000 will cause us to issue ten 1,000 row deletes. Default: 1000 |
Table: repository_scanning
| Parameters | Description |
|---|---|
| defaultsmartproxy | Specify the SmartProxy for repository scanning. This is the same as Default Repository Smartproxy in Configuration-Operations- Server-VM Server Control in the appliance console. Default: blank |
Table: server
| Parameters | Description |
|---|---|
| case_sensitive_name_search | Specify if you want the search by name on configuration item screens to be case senstive. Default: false |
| custom_logo | Specify if you want to use a custom logo. This is the same as Use Custom Logo in Configuration-Custom Logo-Logo Selection. Default: false |
| events | |
| disk_usage_gt_percent | For ManageIQ operational alerts, specify at what threshold the disk usage alerts will be triggered. Default: 80 |
| heartbeat_timeout | How long to wait until the server heartbeat is considered timed out. if the timeout is exceeded, other appliances in the zone/region can vie for the roles active on the timed out ManageIQ appliance. Default: 2.minutes |
| host | ManageIQ Server’s IP address. Default: blank |
| hostname | ManageIQ Server’s hostname. Default: localhost.localdomain |
| listening_port | Specify the port number on which the web server is listening. Note that this does not set the port that VMDB listens on. When deploying the SmartHost from the ManageIQ appliance, it tells the SmartHost (miqhost) what port to talk to the VMDB on. Default: “443” |
| mks_version | Specify the version of the VMware MKS Plugin to use for the VM Console. This is the same as VMware MKS Plugin Version in Configuration-Operations- Server-VM Console. Default : 2.1.0.0 |
| name | Set the name to display for the ManageIQ appliance that you are logged on to in the appliance console. This is the same as appliance Name in Configuration-Operations- Server-Basic Information. Default : EVM |
| role | Specify the roles for this ManageIQ Server, separated by commas without spaces. The possible values are automate, database_operations, ems_inventory, ems_metrics_collector, ems_metrics_coordinator, ems_metrics_processor, ems_operations, event, notifier, reporting, scheduler, smartproxy, smartstate, user_interface, web_services. This is the same as Server Roles in Configuration-Operations- Server- Server Control. Default: database_operations, event, reporting, scheduler, smartstate, ems_operations, ems_inventory, user_interface, web_services |
| session_store | Where to store the session information for all web requests. The possible values are sql, memory, or cache. SQL stores the session information in the database regardless of the type of database server. Memory stores all the session information in memory of the server process. Cache stores the information in a memcache server. Default: cache |
| startup_timeout | The amount of time in seconds that the server will wait and prevent logins during server startup before assuming the server has timed out starting and will redirect the user to the log page after login. Default: 300 |
| vnc_port | If using VNC for remote console, the port used by VNC. Default: 5800 |
| zone | Set the Zone for this appliance belongs. This is the same as Zone in Configuration-Operations- Server-Basic Information. Default : default |
| :worker_monitor | Starts and monitors the workers. Parameters specified here will override those set in the workers:default section. |
| poll | How often the worker monitor checks for work. This value only is only used when the worker has no more work to do from the queue. It will wait for an amount of time determined by the poll value and poll method. Therefore, if there is constant work on the queue, the worker will not wait in between messages. Default: 15.seconds |
| miq_server_time_threshold | How much time to give the server to heartbeat before worker monitor starts to take action against non-responding server. Default: 2.minutes |
| nice_delta | Tells the worker monitor what Unix “nice” value to assign the workers when starting. A lower number is less nice to other processes. Default: 1 |
| sync_interval | Time interval to sync active roles and configuration for all workers. Default: 30.minutes |
| wait_for_started_timeout | How long to wait for a started worker to heartbeat before considering the worker timed out. Default: 10.minutes |
| kill_algorithm | |
| name | Criteria used to start killing workers. Default: used_swap_percent_gt_value |
| value | Value of the criteria used. Default: 80 |
| start_algorithm | |
| name | After server startup, criteria that must be met to decide if the ManageIQ Server can start a new worker. Default: used_swap_percent_lt_value |
| value | Value of criteria used. Default: 60 |
Table: session
| Parameters | Description |
|---|---|
| interval | Set the time interval in seconds for checking inactive sessions in appliance console. Default: 60 |
| timeout | Set the time period in seconds in which inactive console sessions are deleted. This is the same as Session Timeout in Configuration-Operations-Server-Authentication in the appliance console. Default: 3600 |
| memcache_server | If you choose memory for session_store, you need to specify the memcache_server to retrieve the session information from. Default: 127.0.1.1:11211 |
| memcache_server_opts | Options to send to memcache server. : blank |
| show_login_info | Specify whether or not you want to see login info on start page. Default: true |
Table: smartproxy_deploy
| Parameters | Description |
|---|---|
| queue_timeout | Timeout for host smartproxy deploy job. Default: 30.minutes |
Table: smtp
| Parameters | Description |
|---|---|
| host | Specify the hostname of the smtp mail server. This is the same as Host in Configuration-Operations-Server-Outgoing SMTP E-mail Server. Default: localhost |
| port | Specify the port of the smtp mail server. This is the same as Port in Configuration-Operations-Server-Outgoing SMTP E-mail Server. Default: “25” |
| domain | Specify the domain of the smtp mail server. This is the same as Domain in Configuration-Operations-Server-Outgoing SMTP E-mail Server. Default: mydomain.com |
| authentication | Specify the type of authentication of the smtp mail server. This is the same as Authentication in Configuration-Operations-Server-Outgoing SMTP E-mail Server. Default: login |
| user_name | Specify the username required for login to the smtp mail server. This is the same as User Name in Configuration-Operations-Server-Outgoing SMTP E-mail Server. Default: evmadmin |
| password | Specify the encrypted password for the user_name account. This is the same as Password in Configuration-Operations-Server-Outgoing SMTP E-mail Server. Default: blank |
| from | Set the address that you want to send e-mails from. This is the same as From E-mail Address in Configuration-Operations-Server-Outgoing SMTP E-mail Server. Default: cfadmin@cfserver.com |
Table: snapshots
| Parameters | Description |
|---|---|
| create_free_percent | Ensures the % of free space available on the main datastore (datastore where vmx file is located) can support the % growth of the snapshot. The default is to require space for 100% of the provisioned size of all disks that are taking part in the snapshot. A value of 0 means do not check for space before creating the snapshot. Default: 100 |
| remove_free_percent | Ensures the % of free space available on the main datastore (datastore where vmx file is located) has the % free space available to support the snapshot deletion process. Note that the deletion process consists of first composing a new snapshot then removing it once the original snapshot to be deleted has been collapsed in the VM. The default is to require 100% of the size of all disks to complete this process. A value of 0 means do not check for space before removing the snapshot. Default: 100 |
Table: webservices
| Parameters | Description |
|---|---|
| contactwith | Set to ipaddress to contact miqhost using the IP address. Set to hostname to contact miqhost by its hostname. Set to resolved_ipaddress to take the hostname and resolve it to an IP address. Default: ipaddress |
| mode | Set to invoke to use webservices. Set to disable to turn off webservices. This is the same as Mode in Configuration-Operations- Server-Web Services in the appliance console. Default: invoke |
| nameresolution | If set to true, the hostname will be resolved to an IP address and saved with the host information in the VMDB. Default: false |
| security | If Web Services are enabled, you can set this to ws-security. This is the same as Security in Configuration-Operations- Server-Web Services in the appliance console. Note: This is not currently supported. Default: none |
| timeout | Specify the web service timeout in seconds. Default: 120 |
| password | Specify the encrypted password for the user_name account. This is the same as Password in Configuration-Operations-Server-Outgoing SMTP E-mail Server. Default: blank |
| use_vim_broker | Controls if the vim_broker is used to communicate with VMware infrastructure. Default: true |
Table: workers
| Parameters | Description |
|---|---|
| worker_base | |
| defaults | If the following parameters are NOT explicitly defined for a specific worker, then these values will be used. |
| count | Number of this type of worker. Default: 1 |
| gc_interval | How often to do garbage collection for this worker. Default: 15.minutes |
| poll | How often the workers checks for work. This value only is only used when the worker has no more work to do from the queue. It will wait for an amount of time determined by the poll value and poll method. Therefore, if there is constant work on the queue, the worker will not wait in between messages. Default: 3.seconds |
| poll_method | If set to normal, the worker checks for work the number of seconds set in the poll parameter. If set to escalate, the worker will increase the time between checks when there is no work to be done. Default: normal |
| poll_escalate_max | The maximum number of time to wait between checks for work. Poll_method must be set to escalate for this option to be used. Default: 30.seconds |
| heartbeat_freq | How often to “heartbeat” the worker. Default: 60.seconds |
| heartbeat_method | Set which way to dispatch work. Possible values are sql or drb. Default: drb |
| heartbeat_timeout | How long to wait until the worker heartbeat is considered timed out. Default: 2.minutes |
| parent_time_threshold | How long to allow the parent to go without heartbeating before considering the “parent’ not responding. For workers, the worker monitor is the parent. For Worker monitor, the Server is the parent. Default: 3.minutes |
| memory_threshold | How much memory to allow the worker to grow to before gracefully requesting it to exit and restart. Default: 150.megabytes |
| nice_delta | Tells the worker monitor what Unix “nice” value to assign the workers when starting. A lower number is less nice to other processes. Default: 10 |
| restart_interval | How long to let a worker remain up before asking it to restart. All queue based workers are set to 2.hours and every other worker does not get restarted by a 0.hours value. Default: 0.hours |
| starting_timeout | How long to wait before checking a worker’s heartbeat when it is starting up to mark it as not responding, similar to a grace period before you begin monitoring it. Default: 10.minutes |
| event_catcher | Associated with Event Monitor Server Role. Captures ems events and queues them up for the event_handler to process. Parameters specified here will override those set in the worker_base:default section. |
| ems_event_page_size | Internal system setting which sets the maximum page size for the event collector history. This should not be modified. Default: 100 |
| ems_event_thread_shutdown_timeout | Internal system setting which determines how long the event catcher at shutdown will wait for the event monitor thread to stop. This should not be modified. Default: 10.seconds |
| memory_threshold | How much memory to allow the worker to grow to before gracefully requesting it to exit and restart. Default: 2.gigabytes |
| nice_delta | Tells the worker monitor what Unix “nice” value to assign the workers when starting. A lower number is less nice to other processes. Default: 1 |
| poll | How often the workers checks for work. This value only is only used when the worker has no more work to do from the queue. It will wait for an amount of time determined by the poll value and poll method. Therefore, if there is constant work on the queue, the worker will not wait in between messages. Default: 1.seconds |
| event_catcher_redhat | Contains settings that supersede the event_catcher for event_catcher_redhat. |
| event_catcher_vmware | Contains settings that supersede the event_catcher for event_catcher_vmware. |
| poll | How often the workers checks for work. This value only is only used when the worker has no more work to do from the queue. It will wait for an amount of time determined by the poll value and poll method. Therefore, if there is constant work on the queue, the worker will not wait in between messages. Default: 1.seconds |
| event_catcher_openstack | Contains settings that supersede the event_catcher for event_catcher_openstack. |
| poll | How often the workers checks for work. This value only is only used when the worker has no more work to do from the queue. It will wait for an amount of time determined by the poll value and poll method. Therefore, if there is constant work on the queue, the worker will not wait in between messages. Default: 15.seconds |
| topics | List of AMQP topics that should be monitored by ManageIQ when gathering events from OpenStack. |
| duration | Qpid Specific. Length of time (in seconds) the receiver should wait for a message from the Qpid broker before timing out. Default: 10.seconds |
| capacity | Qpid Specific. The total number of messages that can be held locally by the Qpid client before it needs to fetch more messages from the broker. Default: 50.seconds |
| amqp_port | Port used for AMQP. Default: 5672 |
| schedule_worker | Settings for Scheduler Server Role and any other work that runs on a schedule. Parameters specified here will override those set in the worker_base:default section. |
| db_diagnostics_interval | How frequently to collect database diagnostics statistics. Default: 30.minutes |
| job_proxy_dispatcher_interval | How often to check for available SmartProxies for SmartState Analysis jobs. Default: 15.seconds |
| job_proxy_dispatcher_stale_message_check_interval | How often to check for the dispatch message in the queue Default: 60.seconds |
| job_proxy_dispatcher_stale_message_timeout | Kill a message if this value is reached. Default: 2.minutes |
| job_timeout_interval | How often to check to see if a job has timed out. Default: 60.seconds |
| license_check_interval | How often to check for valid license. Default: 1.days |
| memory_threshold | How much memory to allow the worker to grow to before gracefully requesting it to exit and restart. Default: 150.megabytes |
| nice_delta | Tells the worker monitor what Unix “nice” value to assign the workers when starting. A lower number is less nice to other processes. Default: 3 |
| performance_collection_interval | Controls how often the schedule worker will put performance collection request on the queue to be picked up by the collection worker. Default: 3.minutes |
| performance_collection_start_delay | How long after ManageIQ Server has started before starting capacity and utilization collection, if collection needs to be done. Default: 5.minutes |
| poll | How often the workers checks for work. This value only is only used when the worker has no more work to do from the queue. It will wait for an amount of time determined by the poll value and poll method. Therefore, if there is constant work on the queue, the worker will not wait in between messages. Default: 15.seconds |
| server_logs_stats_interval | How often to log the ManageIQ Server statistics. Default: 5.minutes |
| server_stats_interval | How often to collect the ManageIQ Server statistics. Default: 60.seconds |
| session_timeout_interval | How often to check to see if a UI (appliance console) session has timed out. Default: 30.seconds |
| storage_file_collection_interval | How often to perform file inventory of storage locations. Default: 1.days |
| storage_file_collection_time_utc | What time to perform file inventory of storage locations. Default: “06:00” |
| vdi_refresh_interval | How often to refresh vdi inventory. Default: 20.minutes |
| vm_retired_interval | How often to check for virtual machines that should be retired. Default: 10.minutes |
| vm_scan_interval | How often to check virtual machines to see if scan needs to be done. Default: 10.minutes |
| smis_refresh_worker | Settings for Storage Inventory Server Role and any other work that runs on a schedule. Parameters specified here will override those set in the worker_base:default section |
| poll | How often the workers checks for work. This value only is only used when the worker has no more work to do from the queue. It will wait for an amount of time determined by the poll value and poll method. Therefore, if there is constant work on the queue, the worker will not wait in between messages. Default: 15.seconds |
| connection_pool_size | Maximum number of database connections allowed per process. Default: 5 |
| memory_threshold | How much memory to allow the worker to grow to before gracefully requesting it to exit and restart. Default: 1.gigabytes |
| nice_delta | Tells the worker monitor what Unix “nice” value to assign the workers when starting. A lower number is less nice to other processes. Default: 3 |
| smis_update_period | How frequently to update smis information. Default: 1.hours |
| status_update_period | How frequently to update smis status. Default: 5.minutes |
| stats_update_period | How frequently to update smis statistics. Default: 10.minutes |
| vim_broker_worker | Launched for any of these roles: Capacity & Utilization Collector, SmartProxy, SmartState Analysis, Management System Operations, Management System Inventory. Also launched if the use_vim_broker setting is on. Provides connection pooling, caching of data to and from the VMware infrastructure. Parameters specified here will override those set in the workers:default section. |
| heartbeat_freq | How often to heartbeat the worker. Default: 15.seconds |
| memory_threshold | How much memory to allow the worker to grow to before gracefully requesting it to exit and restart. Default: 1.gigabytes |
| nice_delta | Tells the worker monitor what Unix “nice” value to assign the workers when starting. A lower number is less nice to other processes. Default: 3 |
| poll | How often the workers checks for work. This value only is only used when the worker has no more work to do from the queue. It will wait for an amount of time determined by the poll value and poll method. Therefore, if there is constant work on the queue, the worker will not wait in between messages. Default: 1.seconds |
| reconnect_retry_interval | Period after which connection is retried. Default: 5.minutes |
| vim_broker_status_interval | Internal system setting which configures how much time to wait after receiving event updates before checking for more updates. Default: 0.seconds |
| wait_for_started_timeout | Time between the worker’s preload and startup time before considering the worker timed out. Default: 10.minutes |
| ui_worker: | Settings for User Interface Server Role. Parameters specified here will override those set in the worker_base:default section. |
| connection_pool_size | Maximum number of database connections allowed per process. Default: 5 |
| memory_threshold | How much memory to allow the worker to grow to before gracefully requesting it to exit and restart. Default: 1.gigabytes |
| nice_delta: 1 | Tells the worker monitor what Unix “nice” value to assign the workers when starting. A lower number is less nice to other processes. Default: 1 |
| poll | How often the workers checks for work. This value only is only used when the worker has no more work to do from the queue. It will wait for an amount of time determined by the poll value and poll method. Therefore, if there is constant work on the queue, the worker will not wait in between messages. Default: 60.seconds |
| web_service_worker | Settings for Web Services Server Role. Parameters specified here will override those set in the worker_base:default section. |
| connection_pool_size | Maximum number of database connections allowed per process. Default: 5 |
| memory_threshold | How much memory to allow the worker to grow to before gracefully requesting it to exit and restart. Default: 1.gigabytes |
| nice_delta | Tells the worker monitor what Unix “nice” value to assign the workers when starting. A lower number is less nice to other processes. Default: 1 |
| poll | How often the workers checks for work. This value only is only used when the worker has no more work to do from the queue. It will wait for an amount of time determined by the poll value and poll method. Therefore, if there is constant work on the queue, the worker will not wait in between messages. Default: 60.seconds |
| queue_worker_base | Base class of all queue workers that work off of the queue.. |
| defaults | If the following parameters are NOT explicitly defined for a queue worker, then these values will be used. |
| cpu_usage_threshold | How much cpu to allow the worker to grow to before gracefully requesting it to exit and restart. Default: 100.percent |
| queue_timeout | How long a queue message can be worked on before it is considered timed out. Default: 10.minutes |
| memory_threshold | How much memory to allow the worker to grow to before gracefully requesting it to exit and restart. Default: 400.megabytes |
| restart_interval | Queue workers restart interval. Default: 2.hours |
| poll_method | If set to normal, the worker checks for work the number of seconds set in the poll parameter. If set to escalate, the worker will increase the time between checks when there is no work to be done. Default: normal |
| generic_worker | Performs work that is not classified as any specific type of work. Processes all normal priority or non-specific queue items. Parameters specified here will override those set in the queue_worker_base:default section |
| count | Number of this type of worker. Default: 4 |
| ems_refresh_worker | Performs all ems (management system) refreshes to keep the vmdb in sync with the state of the components of the virtual infrastructure in the various management systems. Parameters specified here will override those set in the queue_worker_base:default section |
| poll | How often the workers checks for work. This value only is only used when the worker has no more work to do from the queue. It will wait for an amount of time determined by the poll value and poll method. Therefore, if there is constant work on the queue, the worker will not wait in between messages. Default: 10.seconds |
| memory_threshold | How much memory to allow the worker to grow to before gracefully requesting it to exit and restart. Default: 2.gigabytes |
| nice_delta | Tells the worker monitor what Unix “nice” value to assign the workers when starting. A lower number is less nice to other processes. Default: 7 |
| restart_interval | Queue workers restart interval. Default: 2.hours |
| queue_timeout | How long a message can be worked on before it is considered timed out. Default: 120.minutes |
| event_handler | Associated with Event Monitor Server Role. Handles all events caught by the event catcher worker. Parameters specified here will override those set in the workers:default section. Parameters specified here will override those set in the queue_worker_base:default section |
| cpu_usage_threshold | How much cpu to allow the worker to grow to before gracefully requesting it to exit and restart. The value of 0 means that this worker will never be killed due to CPU usage. Default: 0.percent |
| nice_delta | Tells the worker monitor what Unix “nice” value to assign the workers when starting. A lower number is less nice to other processes. Default: 7 |
| perf_collector_worker | Connects to VC/ESX to collect the raw performance data. Same as the Capacity & Utilization Data Collector Server Role. Parameters specified here will override those set in the queue_worker_base:default section count. Number of this type of worker. Default: 2 |
| count | Number of this type of worker. Default: 2 |
| poll_method | If set to normal, the worker checks for work the number of seconds set in the poll parameter. If set to escalate, the worker will increase the time between checks when there is no work to be done. Default: escalate |
| nice_delta | Tells the worker monitor what Unix “nice” value to assign the workers when starting. A lower number is less nice to other processes. Default: 3 |
| perf_processor_worker | Processes the raw performance data into a reportable format. Same as the Capacity & Utilization Data Processor Server Role. Parameters specified here will override those set in the queue_worker_base:default section |
| count | Number of this type of worker. Default: 2 |
| poll_method | If set to normal, the worker checks for work the number of seconds set in the poll parameter. If set to escalate, the worker will increase the time between checks when there is no work to be done. Default: escalate |
| memory_threshold | How much memory to allow the worker to grow to before gracefully requesting it to exit and restart. Default: 400.megabytes |
| nice_delta | Tells the worker monitor what Unix “nice” value to assign the workers when starting. A lower number is less nice to other processes. Default: 7 |
| priority_worker | Performs all high priority queue items including many tasks on behalf of the UI. UI requests are normally executed by a priority worker so they will not to block the UI. Parameters specified here will override those set in the queue_worker_base:default section |
| count | Number of this type of worker. Default: 2 |
| memory_threshold | How much memory to allow the worker to grow to before gracefully requesting it to exit and restart. Default: 200.megabytes |
| nice_delta | Tells the worker monitor what Unix “nice” value to assign the workers when starting. A lower number is less nice to other processes. Default: 1 |
| poll | How often the workers checks for work. This value only is only used when the worker has no more work to do from the queue. It will wait for an amount of time determined by the poll value and poll method. Therefore, if there is constant work on the queue, the worker will not wait in between messages. Default: 1.seconds |
| reporting_worker | Compiles reports. Settings for Reporting Server Role. Parameters specified here will override those set in the queue_worker_base:default section |
| count | Number of this type of worker. Default: 2 |
| nice_delta | Tells the worker monitor what Unix “nice” value to assign the workers when starting. A lower number is less nice to other processes. Default: 7 |
| smart_proxy_worker | Performs the embedded scanning of virtual machines. Settings for SmartProxy Server Role. Parameters specified here will override those set in the queue_worker_base:default section |
| count | Number of this type of worker. Default: 3 |
| memory_threshold | How much memory to allow the worker to grow to before gracefully requesting it to exit and restart. Default: 600.megabytes |
| queue_timeout | How long a queue message can be worked on before it is considered timed out. Default: 20.minutes |
| restart_interval | Queue workers restart interval. Default: 2.hours |
Schedules
Scheduling SmartState Analyses
From the Schedules area in Settings, you can schedule the analyses of virtual machines, hosts, clusters, and datastores to keep the information current. Depending on which resource you want to analyze, you can filter which ones to analyze. You may also specify only one virtual machine or perform an analysis on all virtual machines. In addition, you can schedule compliance checks, and database backups.
Scheduling a SmartState Analysis or Compliance Check
To schedule a SmartState Analysis or Compliance Check:
-
Browse to Settings > Application Settings.
-
Click on the Settings accordion, then click Schedules.
-
Click
(Configuration), and (Add a new Schedule). -
In the Basic Information area, type in a Name and Description for the schedule.
-
Select Active to enable this scan.
-
From the Action list, select the type of analysis to schedule. Based on the type of analysis you choose, you are presented with one of the following group boxes:
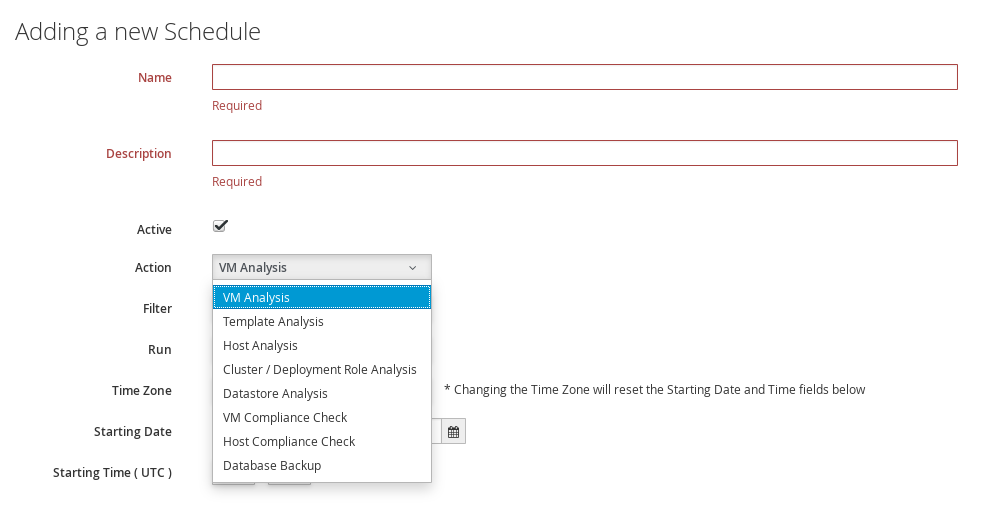
-
VM Analysis: Displays VM Selection where you can choose to analyze All VMs, All VMs for Provider, All VMs for Cluster, All VMs for Host, A single VM, or Global Filters.
-
Template Analysis: Displays Template Selection where you can choose to analyze All Templates, All Templates for Provider, All Templates for Cluster, All Templates for Host, A single Template, or Global Filters.
-
Host Analysis: Displays Host Selection where you can choose to analyze All Hosts, All Hosts for Provider, A single Host, or Global Filters.
Note:
You can only schedule host analyses for connected virtual machines, not repository virtual machines that were discovered through that host. Since repository virtual machines do not retain a relationship with the host that discovered them, there is no current way to scan them through the scheduling feature. The host is shown because it may have connected virtual machines in the future when the schedule is set to run.
-
Cluster / Deployment Role Analysis: Displays Cluster Selection where you can choose to analyze All Clusters, All Clusters for Provider, or A single Cluster.
-
Datastore Analysis: Displays Datastore Selection where you can choose to analyze All Datastores, All Datastores for Host, All Datastores for Provider, A single Datastore, or Global Filters.
-
VM Compliance Check: Displays VM Selection where you can choose to analyze All VMs, All VMs for Provider, All VMs for Cluster, All VMs for Host, A single VM, or Global Filters.
-
Host Compliance Check: Displays Host Selection where you can choose to analyze All Hosts, All Hosts for Provider, All Hosts for Cluster, A single Host, or Global Filters.
-
Database Backup: Under Type, displays Network File System, Samba, Amazon AWS S3 and OpenStack Swift..
-
-
By applying Global Filters within any of the above items, you can designate which virtual machines or hosts to analyze.
-
In Run, set the frequency of the analysis to run. There are further options based on which Run option you choose.
-
Click Once to have the analysis run only one time.
-
Click Daily to run the analysis on a daily basis. You will be prompted to select the number of days between each analysis.
-
Click Hourly to run the analysis hourly. You will be prompted to select the number of hours between each analysis.
-
-
Select a Time Zone.
Note:
If you change the Time Zone, you will need to reset the stating date and time.
-
Type or select a date to begin the schedule in Starting Date.
-
Select a Starting Time based on a 24 hour clock in the selected Time Zone.
-
Click Add.
Modifying a Schedule
To modify a schedule:
-
Browse to Settings > Application Settings.
-
Click on the Settings accordion, then click Schedules.
-
Click the schedule that you want to edit.
-
Click
(Configuration), and then click
(Edit this Schedule). -
Make the required changes.
-
Click Save.
Importing and Exporting Schedules
ManageIQ provides the ability to import and export
schedules using the import_export_schedules.rb script:
./var/www/miq/vmdb/tools/import_export_schedules.rb -h
| Option | Description |
|---|---|
| -u, –user=<s> | userid (default: admin) |
| -d, –output-dir=<s> | Output directory (default: ./) |
| -s, –schedule=<s> | Schedule name or id |
| -o, –operation=<s> | Export or import (default: export) |
| -y, –import-yaml=<filename/uri> | Imported yaml |
| -h, –help | Show this message |
Usage Example.
Import:
./var/www/miq/vmdb/tools/import_export_schedules.rb -o import -y ./filename.yaml
Export:
./var/www/miq/vmdb/tools/import_export_schedules.rb -s 158
Note that the import_export_schedules.rb script works for all types of
schedules, including:
-
Report
-
Policy
-
Alert
-
SmartState Analysis
-
Automation Task
-
Service Template
Access Control
Browse to Settings > Application Settings. Click on the Access Control accordion to see a hierarchy of the configurable items for users, groups, roles, and tenants. You can add and modify users, groups, account roles, tenants, and projects.
Creating a Tenant
Tenants are used in ManageIQ for controlling visibility of objects.
To create a tenant:
-
Browse to Settings > Application Settings.
-
Click on the Access Control accordion, then click Tenants.
-
Click on the top-level Tenant, click
(Configuration), and
(Add child Tenant to this Tenant) to create a tenant. -
Enter a name for the tenant in the Name field.
-
Enter a description for the tenant in the Description field.
-
Click Add.
Creating a Project
A tenant can also contain a self-contained child tenant known as a ‘project’. A project cannot have a child tenant, but it is useful for allocating resources to a small group or team within a larger organization.
To create a project:
-
Browse to Settings > Application Settings.
-
Click on the Access Control accordion, then click Tenants.
-
Click on the Tenant where you want to add a Project, click
(Configuration), and (Add Project to this Tenant) to
create a project. -
Enter a name for the project in the Name field.
-
Enter a description for the project in the Description field.
-
Click Add.
Managing Tenant and Project Quotas
Use the following procedure to allocate or edit quotas for tenants and projects.
Note:
Quota is allocated based on the user’s current group. If the user belongs to multiple groups, you must change to the desired group before allocating or editing group quota. See Groups for more details.
-
Browse to Settings > Application Settings.
-
Click on the Access Control accordion, then click Tenants.
-
Click on the Tenant or Project where you want to add a quota, click
(Configuration), and
(Manage quotas for the Selected Item)
to create a quota. -
In the list of pre-built quotas, switch Enforced next to the quota item you want to enable to
Yes. -
In the Value field, enter the constraints you want to apply to the quota.
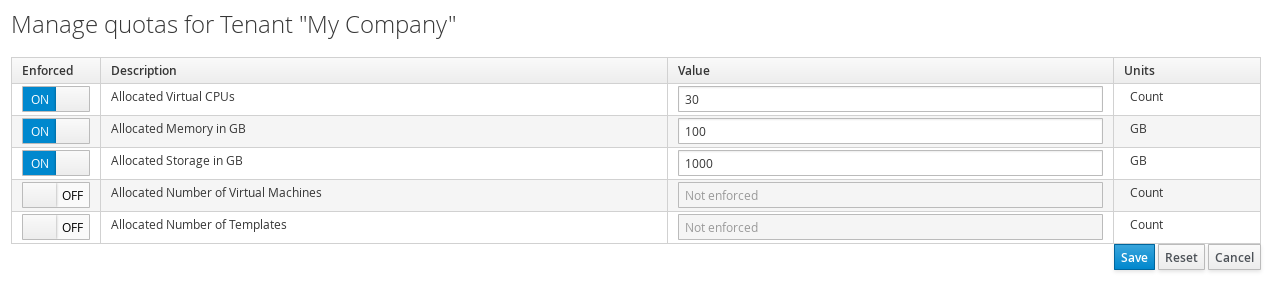
-
Click Save.
Tagging Tenants and Projects
To tag tenants and projects:
-
Browse to Settings > Application Settings.
-
Click on the Access Control accordion, then click Tenants.
-
Select the tenant or project, then click Policy, and select Edit My Company Tags for this Tenant.
-
In Tag Assignment, click Select a customer tag to assign, and select a tag from the list. In the next column, set a corresponding value.
-
Click Save.
Creating a User
To create a user:
-
Browse to Settings > Application Settings.
-
Click on the Access Control accordion, then click Users.
-
Click
(Configuration), and (Add a new User) to create a
user. -
Enter a Full Name, Username, Password with confirmation, and Email Address for the user. An email address is required; omitting the user email address can result in unsuccessful provisioning requests.
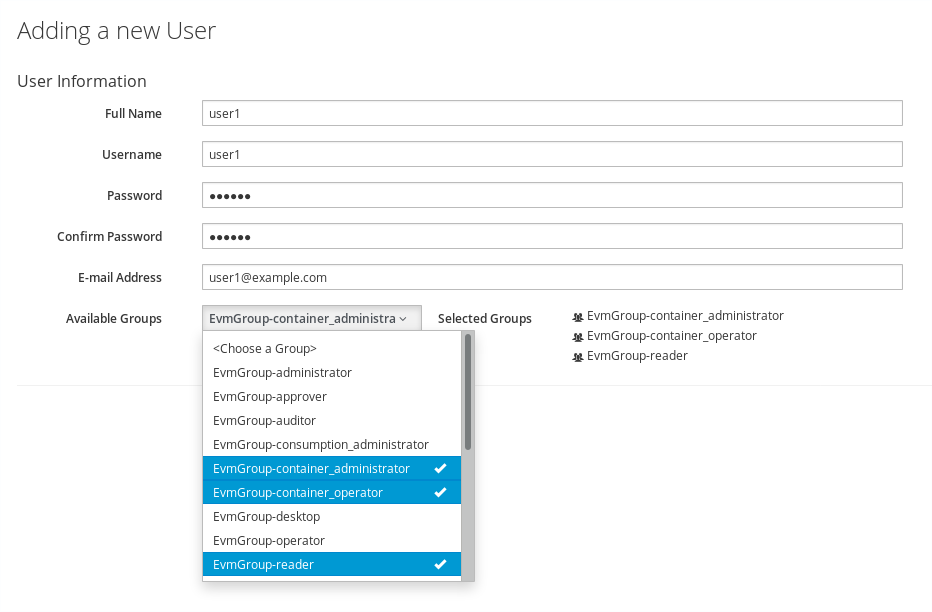 - If you are using LDAP, but did not enable **Get User Groups from LDAP** in your server’s **Authentication** tab, you will need to define a user. The UserID must match exactly the user’s name as defined in your directory service. Use all lowercase characters to ensure the user can be found in the VMDB. - When the user logs in, they use their LDAP password.
 -
Select one or more groups from Available Groups.
-
Click Add.
Deleting a User
For security reasons, delete any user that no longer needs access to the information or functions of the server.
To delete a user:
-
Browse to Settings > Application Settings.
-
Click on the Access Control accordion, then click Users.
-
Select the user you want to delete.
-
Click
(Configuration), and (Delete selected Users) to
delete a user.
Groups
User groups create filters and assign roles to users. You can either create your own groups, or leverage your LDAP directory service to assign groups of users to account roles. For a list of what each pre-defined account role can do, see Roles.
A user can exist in multiple groups. However, a group can only be assigned one account role.
If you belong to multiple groups, you can change the current group. The Current Group affects quota and other settings for the user, including permissions for controlling the tasks that you can complete and the data that you can view. To change the group, click the group name in the upper left of the screen, and select your preferred group from the listed groups.
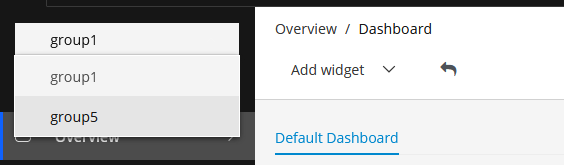
Creating a Group
To create a user group:
-
Browse to Settings > Application Settings.
-
Click on the Access Control accordion, then click Groups.
-
Click
(Configuration), and (Add a new Group) to create a
group. -
Enter a name for the group in the Name field. To ensure compatibility with tags, use underscores in place of spaces. For example, ManageIQ-
test_group. -
Select a Role to map to this group. For a description of each ManageIQ role, see Account Roles and Descriptions.
-
Select the Project/Tenant this group must belong to.
-
Limit what users in this group can view by selecting filters in the Assign Filters area.
-
Click the <My Company> Tags tab to select the tags that users in this group can access. Resources with the selected tags attached can be accessed by this group. Select tags using one of the options in the This user is limited to list:
-
Select Specific Tags, then check the boxes for the tags that you want to limit this user to. The items that have changed will show in blue italicized font.
-
Select Tags Based On Expression, then create tags based on an expression using AND, OR, or NOT. This allows you to further limit the resources accessible to a user: for example, to specify a combination of tags that must exist on a resource.
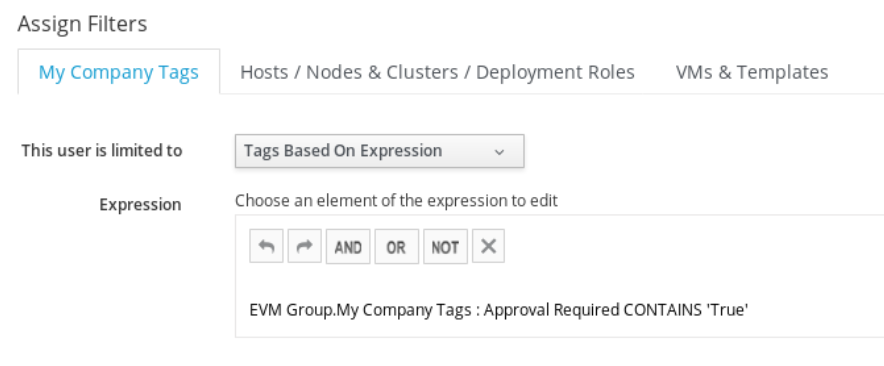
-
-
Click the Host & Clusters tab.
- Check the boxes for the host and clusters that you want to
limit this user to. The items that have changed will show in
blue italicized font.
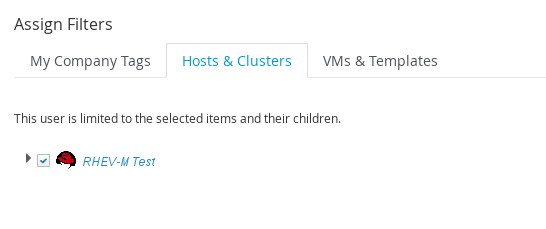
- Check the boxes for the host and clusters that you want to
limit this user to. The items that have changed will show in
blue italicized font.
-
Click the VMs & Templates tab. This shows folders that you have created in your virtual infrastructure.
- Check the boxes for the folders that you want to limit this user to. The items that have changed will show in blue italicized font.
-
-
Click Add.
After creating a group, assign one or more users to the group by editing a user.
Roles
When you create a group, you must specify a role to give the group rights to resources in the console. The group’s role determines the scope of access for the users that are members of the group.
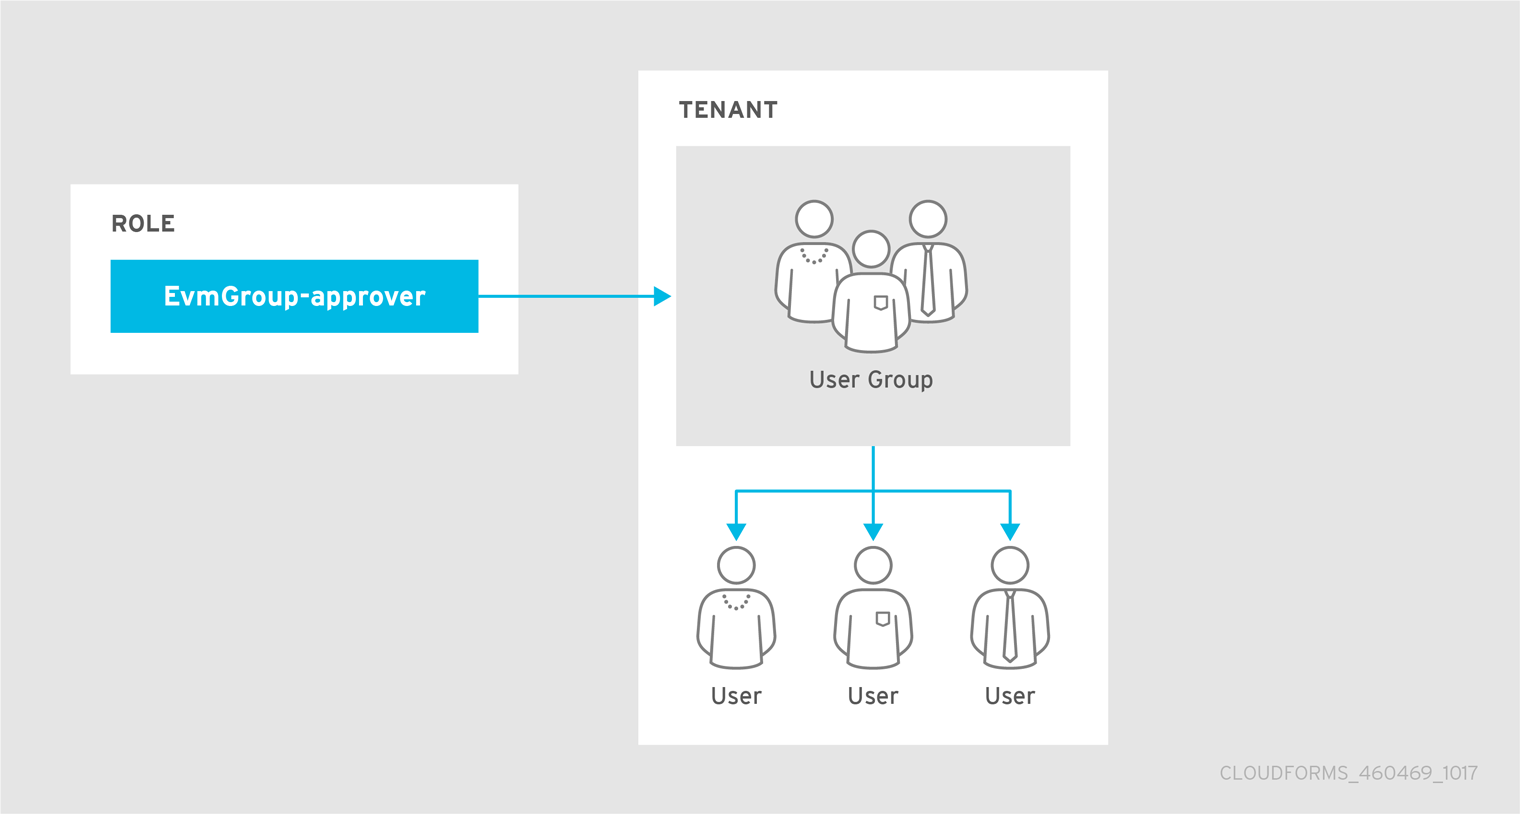
ManageIQ provides a default group of roles, but you can also create your own, or copy and edit the default groups.
Note:
If you have enabled Get Role from LDAP under LDAP Settings, then the role is determined by the LDAP user’s group membership in the directory service.
To view details of a role and its level of access:
-
Browse to Settings > Application Settings.
-
Click on the Access Control accordion, then click Roles.
-
Click on a role from the list to display role information and the product features the role can access (marked by a checkmark). You can expand the categories under Product Features to see further detail.
The table below shows a summary of the functions available to each role.
Account Roles and Descriptions
| Role | Description |
|---|---|
| Administrator | Administrator of the virtual infrastructure. Can access all infrastructure functionality. Cannot change server configuration. |
| Approver | Approver of processes, but not operations. Can view items in the virtual infrastructure, view all aspects of policies and assign policies to policy profiles. Cannot perform actions on infrastructure items. |
| Auditor | Able to see virtual infrastructure for auditing purposes. Can view all infrastructure items. Cannot perform actions on them. |
| Container Administrator | Administrator with capabilities to configure, view and execute tasks on all containers and related underlying infrastructure. Has access to Nodes, Pods and Projects dashboards. |
| Container Operator | This role can view and execute tasks related to containers and related underlying infrastructure. The Container Operator has access to locked versions of the same dashboards as the Container Administrator. |
| Desktop | Access to VDI pages. |
| Operator | Performs operations of virtual infrastructure. Can view and perform all functions on virtual infrastructure items including starting and stopping virtual machines. Cannot assign policy, but can view policy simulation from Virtual Machine page. |
| Security | Enforces security for the virtual environment. Can assign policies to policy profiles, control user accounts, and view all parts of virtual infrastructure. Cannot create policies or perform actions on virtual infrastructure. |
| Super Administrator | Administrator of ManageIQ and the virtual infrastructure. Can access all functionality and configuration areas. |
| Support | Access to features required by a support department such as diagnostics (logs). Can view all infrastructure items and logs. Cannot perform actions on them. |
| Tenant Administrator | Configures settings applicable to a Tenant. Sets Branding, maps groups/roles, configures LDAP credentials, and configures dashboard settings. |
| Tenant Quota Administrator | Configures quota limits for the tenant, applying usage constraints for CPU, Memory, Storage, Maximum number of VMs, and Maximum number of Templates. |
| User | User of the virtual infrastructure. Can view all virtual infrastructure items. Cannot perform actions on them. |
| User Limited Self Service | Limited User of virtual machines. Can make provision requests. Can access some functions on the virtual machine that the user owns including changing power state. |
| User Self Service | User of virtual machines. Can make provision requests. Can access some functions on the virtual machine that the user owns and that the user’s LDAP groups own including changing power state. |
| Vm User | User of virtual machines. Can access all functions on the virtual machine including changing power state and viewing its console. Cannot assign policy, but can view policy simulation from virtual machine page. |
Creating a Role
To create a role:
-
Click Settings > Application Settings.
-
Click on the Access Control accordion, then click Roles.
-
Click Configuration, and
Add a new Role. Alternatively, you can copy an existing role to a new role by clicking Copy the selected Role to a new Role. -
In the Role Information area, type a name for the new role. For Access Restriction for Catalog Items, Orchestration Stacks, Key Pairs, Services, VMs, and Templates, select if you want to limit users with this role to only see resources owned by the user or their group, owned by the user, or all resources (None):
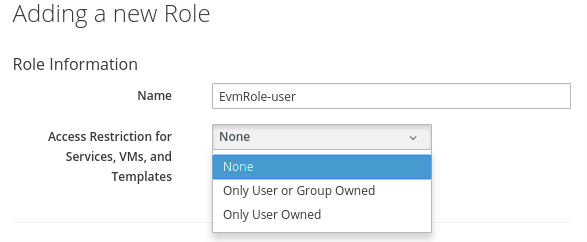
-
Under Product Features (Editing), navigate to the appropriate feature and enable or disable it:
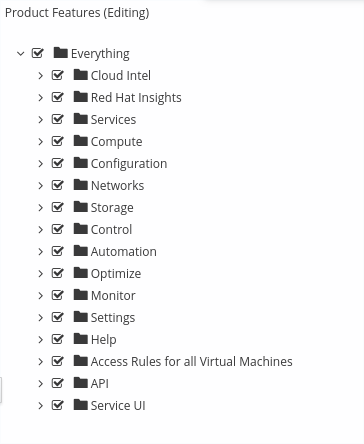
-
Click Add.
Diagnostics
Browse to Settings > Application Settings. Click on the Diagnostics tab to see the status of the different ManageIQ roles and workers for each server, view and collect logs, and gather data if there are any gaps in capacity and utilization information. The Diagnostics area is designed in a hierarchy.
-
At the region level, you can see replication status, backup the VMDB, and run garbage collection on the VMDB.
-
At the zone level, you can see ManageIQ roles by servers and servers by roles. In addition, you can set log collection values for a specific zone, and collect gap data for capacity and utilization.
-
At the server level, you can see the workers for each server, set log collection values for a specific server, and view current logs.
Region Diagnostics
Using the console, you can set the priority of server regional roles, review and reset replication, and create backups of your database either on demand or on a schedule.
Regions are used primarily to consolidate multiple VMDBs into one master VMDB for reporting while zones are used to define functional groups of servers. There can be only one region per VMDB, but multiple zones per region (or VMDB). Some server roles are aware of each other across ManageIQ appliances at the region level. This means that redundancy and failover rules apply at the region level. You can also set priorities for the server roles that provide failover.
Server Role Priorities
If you have multiple servers in your environment with duplicate failover roles, then you can set the priority of the server role.
-
Only server roles that support failover can be marked as primary. These roles only allow one server to be active at a time. These are Notifier, Capacity & Utilization Coordinator, Event Monitor, Scheduler, Storage Inventory, and Provider Inventory.
-
All other server roles are additive. The more servers with that role in a zone the more work that can be performed.
There are three role priorities.
-
Primary: There can only be one primary per zone or region per role. When an appliance is started, the system looks to see if any role is set to primary. If that is the case, the role is activated on that appliance and deactivated from the secondary. In the console, primary roles are shown in bold letters. The text turns red if the server goes down. You must actively set the primary priority.
-
Secondary: This is the default priority. There can be multiple secondaries. When an appliance is started, if no primary is found in the zone, the first appliance to start takes the role. In the console, secondary roles are displayed normally with the word “secondary”.
-
Tertiary: If all appliances with primary roles or secondary roles were down, one of the tertiary would be activated. The reason for tertiary is to ensure that if a server with crucial roles such as Provider Inventory or Event Monitor goes down, you have a way to associate those roles to different appliances by organizing the priorities. Tertiary roles simply show as active in the console.
Region Aware Server Roles
| Role | More than one per Region | Can have Priority Set |
|---|---|---|
| Automation Engine | Y | N |
| Database Operations | Y | N |
| Notifier | N | Y |
| Reporting | Y | N |
| Scheduler | N | Y |
| User Interface | Y | N |
| Web Services | Y | N |
Setting the Priority of a Failover Role
To set the priority of a failover role:
-
Browse to Settings > Application Settings.
-
Click on the Diagnostics accordion, then click the Zone that you want to view.
-
Depending on how you want to view your servers, click either the Roles by Servers tab or the Servers by Roles tab.
-
In the Status of Roles for Servers in Zone Default Zone area, click on the role that you want to set the priority for.
-
Click
(Configuration), and
(Promote Server) to make this the
primary server for this role. -
Click
(Configuration), and (Demote Server) to demote the
priority of this server for this role.
Zone Diagnostics
The console provides a way to see all the server roles that a server has been assigned and if these roles are running. This is especially helpful when you have multiple servers with different server roles. For each zone you can also set a central place for all logs to be collected, and collect capacity and utilization data that may be missing.
Viewing the Status of Server Roles
To view the status of server roles:
-
Browse to Settings > Application Settings.
-
Click on the Diagnostics accordion, then click the Zone that you want to view.
-
Depending on how you want to view your servers, click either Roles by Servers or the Servers by Roles.
Zone Aware Server Roles
| Role | More than one per Region | Can have Priority Set |
|---|---|---|
| Automation Engine | Y | N |
| Capacity & Utilization Coordinator | N | Y |
| Capacity & Utilization Data Collector | Y | N |
| Capacity & Utilization Data Processor | Y | N |
| Database Operations | Y | N |
| Event Monitor | N | Y |
| Provider Inventory | N | Y |
| Provider Operations | Y | N |
| Notifier | N | Y |
| Reporting | Y | N |
| Scheduler | N | Y |
| SmartProxy | Y | N |
| SmartState Analysis | Y | N |
| User Interface | Y | N |
| Web Services | Y | N |
Removing an Inactive Server
To remove an inactive server:
-
Browse to Settings > Application Settings.
-
Click on the Diagnostics accordion, then click the Zone that you want to view.
-
Click on the name of the server in the tree view.
-
Click
(Delete Server).
This button is available only if the server is inactive.
Zone Log Collections
If you have multiple servers reporting to one central VMDB, then you can collect the configuration files and logs from the console of any of the servers. While you can set this either at the zone or server level, settings at the server level supersede the ones at the zone level.
Log depot options include:
-
Anonymous File Transfer Protocol (FTP)
-
File Transfer Protocol (FTP)
-
Network File System (NFS)
-
Samba
See your network administrator if you need to set up one of these shares. You will also need a user that has write access to that location.
Setting the Location of the Log Depot
To set the location of the log depot:
-
Browse to Settings > Application Settings.
-
Click the Diagnostics accordion, then click the Zone that you want to view.
-
Click Collect Logs.
-
Click
(Edit). -
Select the Type of share.
-
Using the fully qualified domain name (FQDN) of the depot server, type in the appropriate settings for the URI.
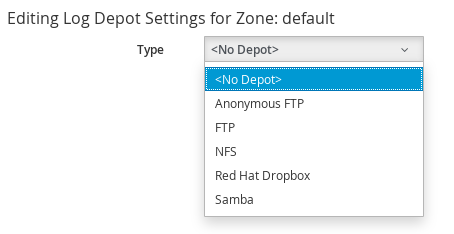
-
If required, enter your user ID and password then click Validate to confirm the settings.
-
Click Save.
Collecting and Downloading Logs from All Servers in a Zone
To collect and download logs from all servers in a zone:
-
Browse to Settings > Application Settings.
-
Click on the Diagnostics accordion, then click the Zone that you want to view.
-
Click the Collect Logs tab.
-
Click
 (Collect all logs). All files in
the logs directory as well as configuration files are collected from
the selected zone.
(Collect all logs). All files in
the logs directory as well as configuration files are collected from
the selected zone. -
Click OK. The status of the log retrieval shows in the ManageIQ console.
Capacity and Utilization Repair
Under certain circumstances, it is possible that ManageIQ is not able to collect capacity and utilization data. This could be due to password expiration, a change in rights to the cloud provider and this change didn’t provide enough granularity to the ManageIQ service account, or network connectivity. The gap data is collected directly by extracting the monthly performance data. Gap collection need to be completed for each zone individually. Therefore, the procedure below need to be repeated for each zone.
Repairing Capacity and Utilization Data
To repair capacity and utilization data:
-
Log in to a ManageIQ appliance located in the zone for which you want to gather the data.
-
Browse to Settings > Application Settings.
-
Click on the Diagnostics accordion, then click the Zone that you want to view.
-
Click C & U Gap Collection.
-
Select the appropriate Timezone.
Note:
Do not select more than one week unless instructed to do so by Support.
-
Select a Start Date.
-
Select an End Date.
-
-
Click Submit.
After the gap collection has completed for this zone, repeat these same steps for the next zone. You can check for completion by going to the clusters page and checking for the capacity and utilization data for the time period specified.
Server Diagnostics
Under Diagnostics for a server, you can view the status of ManageIQ workers running on the server, set log collection setting for only that server, and view the server’s current ManageIQ and audit logs.
Workers
The Workers tab enables you to see the status of and restart ManageIQ workers.
You can see additional information on and restart the following items:
-
C & U Metrics Collectors that collects capacity and utilization data.
-
C & U Metrics Processors, which processes the collected capacity and utilization data.
-
Event Handlers put events from the Event Monitor into the VMDB and starts ManageIQ processes if needed base on that information.
-
Event Monitors that communicate with the external cloud provider to deliver up to date event information.
-
Generic Workers that perform long running and priority processes.
-
Priority Workers that perform high priority, short processes.
-
Schedule Workers that maintains any items that run on a schedule.
-
Session Broker that maintains a single connection to the cloud providers .
-
Refresh Workers that runs the refresh processes.
-
Reporting Workers that generate reports.
-
SmartProxy Workers that run SmartState Analyses on virtual machine.
-
User Interface Worker that allows users access to the console.
-
Web Services Worker that maintains ManageIQ Web services.
-
VM Analysis Collectors that run and process SmartState Analyses on virtual machines.
Reloading Worker Display
To reload worker display:
-
Browse to Settings > Application Settings.
-
Click on the Diagnostics accordion, then click the Zone that you want to view.
-
Select the server that you want to view.
-
Click the Workers tab.
-
Click
 (Refresh Current Workers
display).
(Refresh Current Workers
display).
Restarting a Worker
To restart a worker:
-
Browse to Settings > Application Settings.
-
Click on the Diagnostics accordion, then click the Zone that you want to view.
-
Select the server that you want to view.
-
Click on the Workers tab.
-
Click on the worker you want to restart.
-
Click
(Configuration), then
 (Restart selected worker).
 -
Click OK.
Server and Audit Logs
Collecting Server Logs and Configuration Files
While you can designate a central location to collect logs for all servers in a specific zone, you can override those values for a specific server. To do this, designate a log depot location to store the files.
Log depot options include:
-
Anonymous File Transfer Protocol (FTP)
-
File Transfer Protocol (FTP)
-
Network File System (NFS)
-
Samba
See your network administrator to set up one of these shares. You also need a user that has write access to that location. Settings at the server level supersede the ones at the zone level.
Setting the Location of the Log Depot for a Specific Server
To set the location of the log depot for a specific server
-
Browse to Settings > Application Settings.
-
Click on the Diagnostics accordion, then click the Zone that you want to view.
-
Select the server that you want to collect logs for.
-
Click on the Collect Logs tab.
-
Click
(Edit Log Depot Settings for the
selected Server). -
Select the Type of share.
-
Using the fully qualified domain name (FQDN) of the depot server, type in the appropriate settings for the URI.
-
Enter your user ID and password, then click Validate to confirm the settings.
-
Click Save.
Collecting the Current Log Set of a Server
To Collect the Current Log Set of a Server
-
Browse to Settings > Application Settings.
-
Click on the Diagnostics accordion, then click the Zone that you want to view.
-
Select the server that you want to collect logs for.
-
Click on the Collect Logs tab.
-
Click
(Collect), then click
(Collect current logs). All current
log files in as well as configuration files are collected. -
Click OK. The status of the log retrieval shows in the ManageIQ console.
Collecting All Log Sets from a Server
To Collect All Log Sets from a Server
-
Browse to Settings > Application Settings.
-
Click on the Diagnostics accordion, then click the Zone that you want to view.
-
Select the server that you want to collect logs for.
-
Click Collect Logs.
-
Click
(Collect), then click
(Collect all logs). All files in the
logs directory as well as configuration files are collected. -
Click OK. The status of the log retrieval shows in the ManageIQ console.
Viewing the Server, Audit, and Production Logs
The server and audit logs roll over daily. The previous logs are stored
as zipped files in the /var/www/miq/vmdb/log folder. The current logs
can be easily viewed and downloaded from the settings menu; select
Configuration, then click
on the Diagnostics accordion.
Use the server log to see all actions taken by the server including communication with the SmartProxy and tasks.
Viewing the Server Log
To view the server log:
-
Browse to Settings > Application Settings.
-
Click on the Diagnostics accordion, then click the Zone that you want to view.
-
Select the server that you want to view.
-
Click CFME Log.
The ManageIQ server automatically retrieves the last 1000 lines of the log.
Reloading the Server Log
To reload the server log:
-
Browse to Settings > Application Settings.
-
Click on the Diagnostics accordion, then click the Zone that you want to view.
-
Select the server that you want to view.
-
Click CFME Log.
-
Click
(Reload the Log Display).
Downloading the Server Log
To download the server log:
-
Browse to Settings > Application Settings.
-
Click on the Diagnostics accordion, then click the Zone that you want to view.
-
Select the server that you want to view.
-
Click CFME Log.
-
Click
 (Download the Entire EVM Log
File).
(Download the Entire EVM Log
File).
Note:
Use the Audit Log to see changes to the user interface and authentication.
Viewing the Audit Log
To view the audit log:
-
Browse to Settings > Application Settings.
-
Click on the Diagnostics accordion, then click the Zone that you want to view.
-
Select the server that you want to view.
-
Click Audit Log.
The server automatically retrieves the last 1000 lines of the log.
Reloading the Audit Log
To reload the audit log:
-
Browse to Settings > Application Settings.
-
Click on the Diagnostics accordion, then click the Zone that you want to view.
-
Select the server that you want to view.
-
Click Audit Log.
-
Click
(Reload the Audit Log Display).
Downloading the Audit Log
To download the audit log:
-
Browse to Settings > Application Settings.
-
Click on the Diagnostics accordion, then click the Zone that you want to view.
-
Select the server that you want to view.
-
Click Audit Log.
-
Click
(Download the Entire Audit Log
File).
Viewing the Production Log
Use the production log to see all actions performed using the console.
To view the production log:
-
Browse to Settings > Application Settings.
-
Click on the Diagnostics accordion, then click the Zone that you want to view.
-
Select the server that you want to view.
-
Click Production Log.
The ManageIQ server automatically retrieves the last 1000 lines of the log.
Reloading the Production Log
To reload the production log:
-
Browse to Settings > Application Settings.
-
Click on the Diagnostics accordion, then click the Zone that you want to view.
-
Select the server that you want to view.
-
Click Production Log.
-
Click
(Reload the Product Log
Display).
Downloading the Production Log
To download the production log:
-
Browse to Settings > Application Settings.
-
Click on the Diagnostics accordion, then click the Zone that you want to view.
-
Select the server that you want to view.
-
Click Production Log.
-
Click
(Download the Production Log
File).
Database Operations
Viewing Information on the VMDB
The Database accordion displays a summary of VMDB information, a list of all tables and indexes, settings for the tables, active client connection, and database utilization.
To view information on the VMDB:
-
Browse to Settings > Application Settings.
-
Click the Database accordion.
-
Click VMDB in the tree view on the left.
-
Click the appropriate tab to view the desired information:
-
Summary: displays statistics about the database.
-
Tables: displays a clickable list of all the tables.
-
Indexes: displays a clickable list of all the indexes.
-
Settings: displays a list of all tables, their descriptions, and other valuable Information.
-
Client Connections: displays all current connections to the VMDB.
-
Utilization: displays usage charges for the disk and index nodes.
-
Database Regions and Replication
Regions are used to create a central database for reporting and charting. Do not use the database at the top level for operational tasks such as SmartState analysis or capacity and utilization data collection. Assign each server participating in the region a unique number during the regionalization process, then set your subordinate regions to replicate to the top region.
Important
All ManageIQ databases in a multi-region deployment must use the same security key.
Creating a Region
In principle, a region is created when you set up your ManageIQ environment on the first appliance for the region. However, you can also create a region on an appliance where a database has already been set up. This process involves dropping and rebuilding the existing database to accommodate the new region number, and takes several minutes to complete.
Warning
Performing this procedure destroys any existing data and cannot be undone. Back up the existing database before proceeding. By default, new appliances are assigned region 0. Do not use this number when creating a region because duplicate region numbers can compromise the integrity of the data in the database.
-
Log in to the appliance as the root user.
-
Enter
appliance_console, and press Enter. -
Press any key.
-
Select
Stop EVM Server Processes. -
Enter
Yto confirm. -
Choose
Configure Application. -
Enter a database region number that has not been used in your environment. Do not enter duplicate region numbers because this can corrupt the data.
-
Enter
Yto confirm. -
The menu reappears after all processes are complete.
-
Select
Start EVM Server Processes. -
Enter
Yto confirm. -
Select Quit to exit the advanced settings menu.
Configuring Database Replication and Centralized Administration
To configure database replication, you must configure one ManageIQ instance to act as a global copy, and one or more other instances to act as remote copies. This database replication relationship can only be configured on ManageIQ instances that are of the same version. Configuring database replication in this version of ManageIQ automatically enables centralized administration, eliminating the need for further configuration. Centralized administration in ManageIQ supports life cycle management operations that can be initiated from the global copy and processed and executed on the remote copy.
Important
-
You must configure at least one remote copy before you can configure the global copy. Changes to the role of a ManageIQ instance take several minutes to take effect.
-
The region number must be unique on each ManageIQ instance where replication is configured. See Creating a Region for instructions on how to create a region.
-
Enabling the
EvmRole-user_global_regionrole will only provide access to specific operations that can be performed on a global region.
Configuring a Remote Copy
Configure a ManageIQ instance to act as a remote copy from which data will be replicated to the global copy.
-
Browse to Settings > Application Settings.
-
Click the Settings accordion.
-
Click the region where the instance is located.
-
Click Replication.
-
Select Remote from the Type list.
-
Click Save.
Configuring the Global Copy
Configure a ManageIQ instance to act as the global copy to which data is replicated from the remote copies.
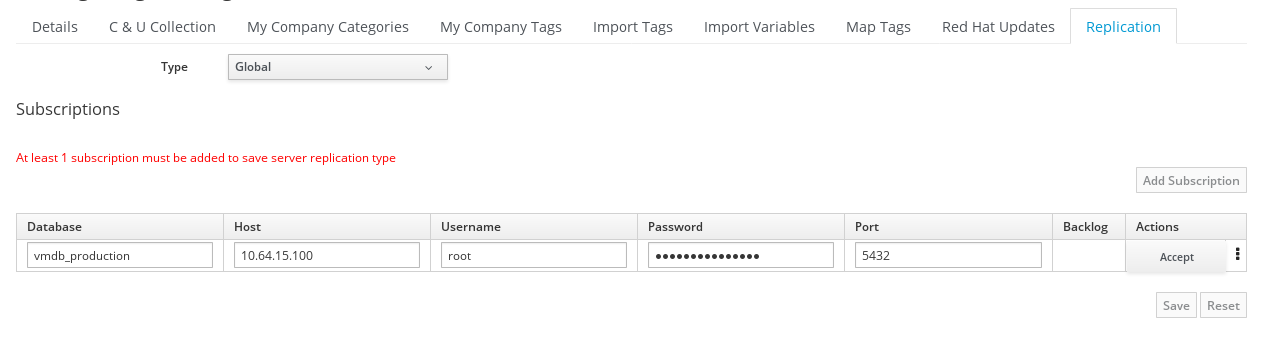
-
Click
Configuration. -
Click the Settings accordion.
-
Click the region where the instance is located.
-
Click Replication.
-
Select Global from the Type list.
-
Click Add Subscription.
-
Enter the name of the database on the remote copy in the Database field.
-
Enter the IP address or fully qualified domain name of the remote copy in the Host field.
-
Enter the name of a database user able to access the database in the Username field.
-
Enter the password of the database user in the Password field.
-
Enter the port by which the database is accessed in the Port field.
-
In Actions, click Accept. You can also Update your subscription if required, or click the menu on the right in order to Validate or Discard.
-
-
Click Save.
Note:
Once you configure a ManageIQ instance to act as a global copy, and one or more other instances to act as remote copies: * centralized administration is automatically enabled after the initial data sync is complete. * you will see the type of region you are logging into (global or remote) on the ManageIQ user interface login screen.
Database replication and centralized administration are now enabled on your instances. To open virtual machines of a remote region from the global region and perform required operations:
-
Browse to menu: Compute < Infrastructure < Virtual Machines, then click VMs & Templates and select a virtual machine in the global region.
-
In the Multi Region table on the summary screen, click Connect to VM in its Region to perform required operations in a new browser tab.
Resetting Database Replication
You can reset the replication relationship between the global copy and remote copies by temporarily removing and re-enabling the subscription from the global copy.
-
Browse to Settings > Application Settings.
-
Click the Settings accordion.
-
Click the region where the instance is located.
-
Click Replication.
-
Remove the subscription:
-
Click the actions button for the subscription to reset.
-
Click OK.
-
-
Click Save.
-
Re-add the subscription:
-
Click Add Subscription.
-
Enter the name of the database on the remote copy in the Database field.
-
Enter the IP address or fully qualified domain name of the remote copy in the Host field.
-
Enter the name of a database user able to access the database in the Username field.
-
Enter the password of the database user in the Password field.
-
Enter the port by which the database is accessed in the Port field.
-
-
Click Save.
Backing Up and Restoring ManageIQ in a Kubernetes Based Environment (podified)
Prerequisites:
- Velero and Restic must be installed and working in your cluster. For more information on Velero, see the Velero documentation. For more information on Restic, see the Restic documentation
Note: The operator adds labels and/or annotations to everything that needs to be backed up. You can easily and quickly backup only what is required. The operator will add annotations for restic volume backups for example, backup.velero.io/backup-volumes: <volume-label>.
- The backup label key can be configured by adding the following to the CR. The default label is applied if no value is specified for
backupLabelName.... spec: ... backupLabelName: <your label name> - Create a backup by running the command:
velero backup create <your backup name>-database --include-namespaces <your namespace> -l <your label name>=db velero backup create <your backup name> --include-namespaces <your namespace> -l <your label name>=t - In order to restore a backup, first ensure the ManageIQ CRD exists. Then, restore the backup by running the commands:
oc new-project <your namespace>
velero restore create --from-backup <your backup name>-database # Wait for restore to finish before continuing
velero restore create --from-backup <your backup name>
Backing Up and Restoring a Database for an Appliance Based Environment
Running a Single Database Backup
ManageIQ supports database backups to Network File System (NFS), Samba, Amazon Web Service(AWS) S3 and OpenStack Swift storage.
Note:
Database backups to AWS S3 require valid AWS credentials to perform this operation.
To run a single database backup:
-
Browse to Settings > Application Settings.
-
Click the Diagnostics accordion and click the Region name.
-
Click the Database tab.
-
If you have created a backup schedule and want to use the same depot settings, select the schedule in the Backup Schedules box.
-
If you do not want to use the settings from a backup schedule, select a type of server for storing the backups from the Type drop-down list in the Database Backup Settings box. You can use Network File System (NFS), Samba or AWS S3.
-
If you select Samba, enter the Depot Name, URI, Username, and a valid Password. Click Validate to check the settings.
-
If you select AWS S3, enter the Depot Name, URI, and select the AWS Region from the drop-down list. Enter the Username, and a valid Password. Click Validate to check the settings.
-
If you select OpenStack Swift, enter the Depot Name, URI, Security Protocol and API Port. Enter the Username, and a valid Password. Click Validate to check the settings.
-
If you select Network File System, enter the URI.
-
-
Click Submit to run the database backup.
Restoring a Database from a Backup
If a database is corrupt or fails, restore it from a backup. You can restore a backup from a local file, NFS, or Samba.
To restore a database from a backup:
-
Save the database backup file as
/tmp/evm_db.backup. ManageIQ looks specifically for this file when restoring a database from a local backup. -
If you are restoring a database backup on a high availability environment, stop the replication manager service (
repmgr13.service). This is not required in other ManageIQ configurations.# systemctl stop repmgr13.service -
Log in to the appliance as the root user.
-
Enter
appliance_console, and press Enter. -
Select
Stop EVM Server Processesto stop processes on all servers that connect to this VMDB. -
Enter
Yto confirm. -
After all processes are stopped, press Enter to return to the menu.
-
Press Enter again to manually configure settings.
-
Select
Restore Database From Backup, then specify the location to restore the backup from in theRestore Database Filemenu:-
If you saved the database backup file locally as
/tmp/evm_db.backup, selectLocal file. You can also restore from aNetwork File System (nfs)orSamba (smb). -
Specify the location of the backup file.
Note:
The appliance console menu may respond slowly if connections are open and the server is still shutting down. If this occurs, wait a minute and try again.
-
-
Enter
Yto keep the database backup after restoring from it. EnterNto delete it. -
Press
Yto confirm. -
After the backup completes, press Enter to return to the menu.
-
Press Enter again to manually configure settings.
-
Select
Start EVM Server Processesto restart all processes on servers that connect to this VMDB. -
Enter
Yto confirm. -
If you are restoring a database backup on a high availability environment, start the replication manager service (
repmgr13.service). This is not required in other ManageIQ configurations.# systemctl start repmgr13.service
Performing a Binary Backup and Restoring the Database
Preserve data at the file system level by performing a binary backup. This includes all databases, users and roles, and other objects.
Note:
This procedure uses the pg_basebackup utility to perform a remote
database backup and create a full replacement of the PostgreSQL data
directory, capturing the exact state of the database when the backup
finishes. For more information on the pg_basebackup utility, see the
PostgreSQL documentation.
Performing a Binary Backup
Create a binary backup and store it as a gzip tar file inside the
ManageIQ backup directory.
-
SSH into the database server as the root user or provide PostgreSQL superuser credentials.
-
Run the
pg_basebackupcommand to create the backup:# pg_basebackup -X fetch -h hostname -U root -Ft -z -D filenameNote:
-h hostname specifies the IP address of the database server.
-D filename specifies the name of the directory created to contain the backup.
Restoring a Database from the Binary Backup
Restore your PostgreSQL binary backup using the following steps. This process will require stopping both EVM and PostgreSQL services before restoring data.
-
Copy the existing backup to the target VM:
# scp filename/base.tar.gz root@hostname:/var/www/miq -
SSH to the target VM:
# ssh root@hostname -
Stop both the EVM and PostgreSQL servers:
# systemctl stop evmserverd # systemctl stop $APPLIANCE_PG_SERVICE -
Rename the existing data directory:
# mv /var/lib/pgsql/data /var/lib/pgsql/data.backup -
Create a clean data directory:
# mkdir /var/lib/pgsql/data -
Unzip the tar file to the new directory:
# tar -xzf /var/www/miq/base.tar.gz -C /var/lib/pgsql/data -
Correct permissions:
# chown postgres:postgres /var/lib/pgsql/data # chmod 700 /var/lib/pgsql/data -
Restart the PostgreSQL and EVM servers:
# systemctl start $APPLIANCE_PG_SERVICE
# systemctl start evmserverd
Running Database Garbage Collection
The database server collects garbage automatically, but Support may occasionally direct you to run database garbage collection manually in order to reclaim unused space in your VMDB.
To run database garbage collection:
-
Browse to Settings > Application Settings.
-
Click the Diagnostics accordion and click the Region name.
-
Click the Database tab.
-
In the Run Database Garbage Collection Now box, click Submit.
Changing the Database Password
Use the following procedures to change the password on appliances containing an internal database, and on worker appliances.
To change the password for an external database, use the procedure in Changing the Password on the Worker Appliances.
Note:
See Appliance Types in the Deployment Planning Guide for a summary of different types of appliances.
Changing the Password on the Database Appliance
ManageIQ provides a default database password for the internal PostgreSQL database.
To change the password, you need to stop the ManageIQ
service, change the password for the PostgreSQL database, run a command
to change the password in the configuration file that evmserverd uses
to access the server, and restart the ManageIQ appliance.
-
Stop the ManageIQ service:
-
SSH into the appliance.
-
To stop the ManageIQ service, run the following command:
service evmserverd stop
-
-
Use
pgadminto change the password for your ManageIQ database (default isvmdb_production). If you do not havepgadmin, you can change the password by running:psql -U root -d vmdb_production-
At the vmdb# prompt, type:
ALTER USER root WITH PASSWORD 'newpassword'; -
To exit
psql, type:\q
-
-
Change the password in the configuration file that
evmserverduses to access the server:/var/www/miq/vmdb/tools/fix_auth.rb --databaseyml --password newpassword -
Restart the ManageIQ service:
service evmserverd start -
Verify that you can log in to the ManageIQ console.
Changing the Password on the Worker Appliances
-
Stop the ManageIQ service:
-
SSH into the appliance.
-
To stop the ManageIQ service, run the following command:
service evmserverd stop
-
-
Change the password in the configuration file that
evmserverduses to access the server:/var/www/miq/vmdb/tools/fix_auth.rb --databaseyml --password newpassword -
Restart the ManageIQ service:
service evmserverd startIn a high availability environment, if using the same PostgreSQL user for replication, you must also change the password in the `/var/lib/pgsql/.pgpass` file on every database node. Additionally, if the password for the user being used for region-to-region replication is changing, users must also change the password in the replication subscription screen. See [Configuring the Global Copy](#configuring-the-global-copy).
Adding a New Appliance to an Existing Region with a Non-default Password
-
Create the new appliance.
-
Start the appliance, but do not go into any of the configuration options, instead SSH into the new appliance.
-
In the /var/www/miq/vmdb directory, create a file called
REGION. Its only contents should be the number of the Region that it is joining. (You could also just copy theREGIONfile from the VMDB appliance.) -
Edit the database.yml file in the /var/www/miq/vmdb directory. (You may want to save from the original.)
-
Replace the contents of the “production” section with the contents of the “base” section.
-
Edit the “host” parameter to match the IP of the appliance hosting the VMDB.
-
Save the new database.yml.
-
-
Run the following command to change the password in the configuration file that
evmserverduses to access the server:/var/www/miq/vmdb/tools/fix_auth.rb --databaseyml --password newpassword -
Restart the new worker appliance:
service evmserverd restart
Creating a Database Dump
Creating a database dump from the appliance console can be used to provide additional information when raising a support case. Options exist to generate a database dump excluding specified tables and to split the database dump into multiple parts.
Database dumps require name or location information based on the Dump
Output File Name selection:
| Local File | Location |
| Network File System (NFS) | Location |
| Samba (SMB) | Location |
| Amazon S3 | Name |
| File Transfer Protocol (FTP) | Location |
| ftp to dropbox.redhat.com | Name |
To create a database dump:
-
SSH into the appliance console as
root. -
Press any key to continue.
-
Type
appliance_consoleand pressEnter. -
From the Advanced Settings, select option 5,
Create a Database Dump. -
Select a
Dump Output File Namefrom the list. -
Enter the location or name to save the dump file to.
-
(Optional) Select tables to exclude from the dump:
-
Enter
Yto exclude tables. SelectNto skip the operation. -
Enter the table names in a space-separated list:
metrics_* vim_performance_states event_streams
-
-
(Optional) Split the database dump output into multiple parts:
-
Enter
Yto split the database dump output. SelectNto skip the operation. -
Enter the size to split by, ex
250Mor1G.
-
The database dump is created and sent to the specified location.
Enabling Events Syndication
You can enable events syndication in the Advanced settings:
-
From the menu, go to Settings > Application Settings.
-
Expand the Settings accordian. When you select the Settings accordion, you are automatically taken to the server list under Zones.
-
Select the zone where the EVM server is located, and select the EVM server.
-
Click the Advanced tab.
You can click the Advanced tab at the zone level to set advanced configuration settings for the entire zone. Or, you can click on the server, and then click the Advanced tab to set advanced configuration settings at the server (appliance) level, which overrides zone-level settings.
-
Find the following configuration:
:event_streams: :history: :keep_events: 6.months :purge_window_size: 1000 :syndicate_events: false -
Set the value for
:syndicate_events:totrue. -
Click Save.
Enabling Inventory Syndication
You can enable inventory syndication in the Advanced settings:
-
From the menu, go to Settings > Application Settings.
-
Expand the Settings accordion. When you select the Settings accordion, you are automatically taken to the server list under Zones.
-
Select the zone where the EVM server is located and select the EVM server.
-
Click the Advanced tab.
You can click the Advanced tab at the zone level to set advanced configuration settings for the entire zone. Or, you can click on the server, and then click the Advanced tab to set advanced configuration settings at the server (appliance) level, which overrides zone-level settings.
-
Find the following configuration:
:ems_refresh: :full_refresh_threshold: 100 :syndicate_inventory: false :raise_vm_snapshot_complete_if_created_within: 15.minutes :refresh_interval: 24.hours -
Set the value for
syndicate_inventorytotrue.
Enabling Metrics Syndication
You can enable metrics syndication in the Advanced settings:
-
From the menu, go to Settings > Application Settings.
-
Expand the Settings accordion. When you select the Settings accordion, you are automatically taken to the server list under Zones.
-
Select the zone where the EVM server is located and select the EVM server.
-
Click the Advanced tab.
You can click the Advanced tab at the zone level to set advanced configuration settings for the entire zone. Or, you can click on the server, and then click the Advanced tab to set advanced configuration settings at the server (appliance) level, which overrides zone-level settings.
-
Find the following configuration:
:performance: :host_overhead: :memory: 2.01.percent :cpu: 0.15.percent :syndicate_metrics: false -
Set the value for :syndicate_metrics: to
true. -
Use C & U Collection Settings to select the clusters and datastores that you want to collect usage data for.
SmartProxies
The embedded SmartProxy can analyze virtual machines that are registered to a host and templates that are associated with a provider.
Installing the SmartProxy from the Console
The server comes with one SmartProxy version already available. It can also be installed on an ESX Server version 3.0.2, 3.5 or 4.
Requirements:
-
On ESX, SSH (Secure Shell) must be enabled. This is usually port 22.
-
300 MB free disk space to install and run the SmartProxy.
-
Administrator or root credentials.
-
The host must already be in the VMDB either by discovery or manually.
Entering Credentials and Operating System for the Target Host
Set the credentials and operating system for the target host to prepare for the installation of SmartProxy.
To Enter Credentials and Operating System for the Target Host:
-
Browse to menu: Compute > Infrastructure > Hosts.
-
Select the host you want to edit.
-
Click Configuration, then
Edit Selected items. -
In Credentials, click the Default tab and enter your login credentials. If you are using domain credentials, the format for User ID must be in the format of
<domainname>\<username>. For ESX hosts, if SSH login is disabled for the default user, click the Remote Login tab and enter a user with remote login access.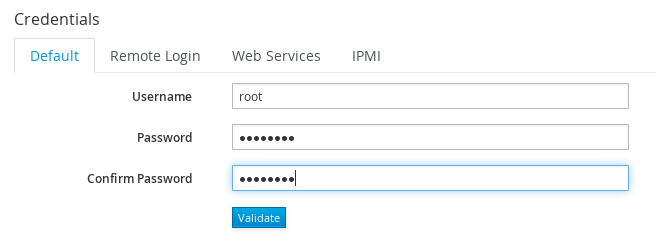 If the target is a Windows host, disconnect all network connections between the Windows proxy and the target. If an existing connection uses a different set of credentials than those set in the console, the installation may fail.
 -
Click Validate to verify the credentials.
-
If you added the host manually instead of Host Discovery or Provider Refresh finding it, select the host’s operating system from the Host Platform drop-down box to ensure the host platform is available.
-
Click Save.
When remotely installing on Windows hosts, the SmartProxy file is first copied to a Windows proxy. That computer then installs the file to the target host. The Windows proxy is the same as when you select the Default Repository SmartProxy box. You can locate this by navigating to the settings menu and selecting Configuration, then clicking on the desired server, then the Server tab, and exploring the Server Control area.
About
Click the question mark icon ( )
at the top right of the ManageIQ user interface to open a
dropdown menu with links to ManageIQ documentation and for information about the current
ManageIQ session.
)
at the top right of the ManageIQ user interface to open a
dropdown menu with links to ManageIQ documentation and for information about the current
ManageIQ session.
-
Click Documentation to open a list of guides. Click the title of a document to view it as a PDF in a new web browser tab.
-
Click About to open a pop-up window showing information about the ManageIQ version and the session of the logged-in user.
Default Roles
This section outlines the default roles provided in ManageIQ and the product features to which they are granted access.
EvmRole-super_administrator
The EvmRole-super_administrator is granted access to the following
product features.
| Product Feature |
|---|
| everything |
EvmRole-super_administrator
EvmRole-administrator
The EvmRole-administrator is granted access to the following product
features.
| Product Feature |
|---|
| about |
| all_vm_rules |
| automation_manager |
| embedded_automation_manager |
| availability_zone |
| host_aggregate |
| compute |
| flavor |
| floating_ip |
| chargeback |
| catalog |
| cloud_network |
| cloud_object_store_container |
| cloud_object_store_object |
| control_explorer |
| dashboard |
| datacenter |
| storage |
| storage_pod |
| ems_cloud |
| ems_network |
| ems_cluster |
| ems_infra |
| ems_infra_admin_ui |
| ems_physical_infra |
| container_dashboard |
| ems_container |
| ems_container_deployment |
| configuration_job |
| container_project |
| container_route |
| container_service |
| container_replicator |
| container_group |
| container |
| container_node |
| persistent_volume |
| container_build |
| container_image_registry |
| container_image |
| container_topology |
| cloud_topology |
| infra_topology |
| host |
| infra_networking |
| miq_ae_class_explorer |
| miq_ae_customization_explorer |
| miq_ae_class_import_export |
| miq_ae_class_log |
| miq_ae_class_simulation |
| miq_task_all_ui |
| miq_task_my_ui |
| my_settings |
| policy_simulation |
| policy_log |
| miq_report |
| miq_request |
| miq_template |
| orchestration_stack |
| physical_server |
| physical_infra_topology |
| planning |
| policy_import_export |
| provider_foreman_explorer |
| pxe |
| resource_pool |
| security_group |
| service |
| timeline |
| usage |
| utilization |
| vm_explorer |
| vm |
| vm_cloud_explorer |
| vm_infra_explorer |
| sui_services |
| sui_notifications |
EvmRole-administrator
EvmRole-approver
The EvmRole-approver is granted access to the following product
features.
| Product Feature |
|---|
| about |
| all_vm_rules |
| compute |
| chargeback |
| chargeback_reports |
| customization_template_view |
| iso_datastore_view |
| control_explorer |
| dashboard |
| ems_cluster_show |
| ems_cluster_show_list |
| ems_cluster_perf |
| ems_cluster_tag |
| ems_cluster_timeline |
| ems_infra_show |
| ems_infra_show_list |
| ems_infra_tag |
| ems_infra_timeline |
| ems_physical_infra_console |
| ems_physical_infra_tag |
| ems_physical_infra_view |
| ems_physical_infra_tag |
| host_show |
| host_show_list |
| host_perf |
| host_tag |
| host_timeline |
| my_settings_default_views |
| my_settings_time_profiles |
| my_settings_visuals |
| miq_report_run |
| miq_report_saved_reports |
| miq_report_schedules |
| miq_report_view |
| miq_request_control |
| miq_request_view |
| miq_task_my_ui |
| miq_template_check_compliance |
| miq_template_perf |
| miq_template_policy_sim |
| miq_template_show |
| miq_template_show_list |
| miq_template_snapshot |
| miq_template_tag |
| miq_template_timeline |
| physical_infra_topology_view |
| physical_server_view |
| policy_log |
| policy_simulation |
| pxe_image_type_view |
| pxe_server_view |
| resource_pool_show |
| resource_pool_show_list |
| resource_pool_tag |
| service_view |
| storage_show |
| storage_show_list |
| storage_pod_show |
| storage_pod_show_list |
| storage_perf |
| storage_tag |
| timeline |
| usage |
| vm_check_compliance |
| vm_console |
| vm_webmks_console |
| vm_cloud_explorer |
| vm_explorer |
| vm_infra_explorer |
| vm_vnc_console |
| vm_vmrc_console |
| cockpit_console |
| vm_perf |
| vm_policy_sim |
| vm_show |
| vm_show_list |
| vm_snapshot |
| vm_tag |
| vm_timeline |
| vm_chargeback |
| sui_services_view |
| sui_vm_details_view |
| sui_vm_console |
| sui_vm_web_console |
| sui_vm_tags |
| sui_orders_view |
| sui_notifications |
EvmRole-approver
EvmRole-auditor
The EvmRole-auditor is granted access to the following product
features.
| Product Feature |
|---|
| about |
| automation_manager |
| embedded_automation_manager |
| compute |
| chargeback |
| chargeback_reports |
| customization_template_view |
| iso_datastore_view |
| control_explorer |
| dashboard |
| ems_cluster_view |
| ems_cluster_tag |
| ems_infra_view |
| ems_infra_tag |
| ems_infra_check_compliance |
| ems_physical_infra_console |
| ems_physical_infra_tag |
| ems_physical_infra_view |
| host_show |
| host_show_list |
| host_perf |
| infra_networking_view |
| infra_networking_tag |
| instance_view |
| instance_check_compliance |
| instance_policy_sim |
| instance_tag |
| image_view |
| image_check_compliance |
| image_policy_sim |
| image_tag |
| iso_datastore_view |
| host_view |
| host_check_compliance |
| host_tag |
| miq_task_my_ui |
| my_settings_default_views |
| my_settings_time_profiles |
| my_settings_visuals |
| miq_report_run |
| miq_report_saved_reports |
| miq_report_schedules |
| miq_report_view |
| miq_template_view |
| miq_template_check_compliance |
| miq_template_policy_sim |
| miq_template_snapshot_view |
| miq_template_tag |
| physical_infra_topology_view |
| physical_server_view |
| planning |
| policy_log |
| policy_profile |
| policy_simulation |
| pxe_image_type_view |
| pxe_server_view |
| resource_pool_show |
| resource_pool_show_list |
| resource_pool_tag |
| service_view |
| storage_show |
| storage_show_list |
| storage_perf |
| storage_tag |
| storage_pod_show |
| storage_pod_show_list |
| timeline |
| usage |
| utilization |
| vm_view |
| vm_check_compliance |
| vm_compare |
| vm_console |
| vm_drift |
| vm_webmks_console |
| vm_cloud_explorer |
| vm_explorer |
| vm_infra_explorer |
| vm_vnc_console |
| vm_vmrc_console |
| cockpit_console |
| vm_perf |
| vm_show |
| vm_show_list |
| vm_snapshot_view |
| vm_tag |
| vm_timeline |
| vm_chargeback |
| sui_services_view |
| sui_vm_details_view |
| sui_vm_console |
| sui_vm_web_console |
| sui_vm_tags |
| sui_notifications |
EvmRole-auditor
EvmRole-desktop
The EvmRole-desktop is granted access to the following product
features.
| Product Feature |
|---|
| about |
| all_vm_rules |
| automation_manager |
| compute |
| dashboard |
| ems_physical_infra |
| miq_request_admin |
| miq_request_view |
| miq_template_clone |
| miq_template_compare |
| miq_template_drift |
| miq_template_edit |
| miq_template_refresh |
| miq_template_miq_request_new |
| miq_template_perf |
| miq_template_publish |
| miq_template_show |
| miq_template_show_list |
| miq_template_timeline |
| my_settings_default_views |
| my_settings_time_profiles |
| my_settings_visuals |
| physical_server |
| physical_infra_topology |
| physical_server_view |
| provider_foreman_explorer |
| vm_clone |
| vm_compare |
| vm_console |
| vm_webmks_console |
| vm_cloud_explorer |
| vm_explorer |
| vm_infra_explorer |
| vm_vnc_console |
| vm_vmrc_console |
| cockpit_console |
| vm_drift |
| vm_edit |
| vm_refresh |
| vm_reset |
| vm_guest_restart |
| vm_miq_request_new |
| vm_perf |
| vm_publish |
| vm_show |
| vm_show_list |
| vm_guest_shutdown |
| vm_start |
| vm_stop |
| vm_suspend |
| vm_pause |
| vm_shelve |
| vm_shelve_offload |
| vm_timeline |
| vm_chargeback |
| sui_services_view |
| sui_vm_details_view |
| sui_vm_console |
| sui_vm_web_console |
| sui_vm_start |
| sui_vm_stop |
| sui_vm_suspend |
| sui_orders_view |
| sui_orders_operations |
| sui_notifications |
EvmRole-desktop
EvmRole-operator
The EvmRole-operator is granted access to the following product
features.
| Product Feature |
|---|
| about |
| all_vm_rules |
| automation_manager |
| embedded_automation_manager |
| compute |
| chargeback |
| chargeback_reports |
| dashboard |
| datastore |
| ems_cluster_analyze |
| ems_cluster_compare |
| ems_cluster_drift |
| ems_cluster_show |
| ems_cluster_show_list |
| ems_cluster_perf |
| ems_cluster_tag |
| ems_cluster_timeline |
| ems_infra_new |
| ems_infra_delete |
| ems_infra_discover |
| ems_infra_edit |
| ems_infra_refresh |
| ems_infra_scale |
| ems_infra_show |
| ems_infra_show_list |
| ems_infra_tag |
| ems_infra_timeline |
| ems_physical_infra_new |
| ems_physical_infra_console |
| ems_physical_infra_delete |
| ems_physical_infra_discover |
| ems_physical_infra_edit |
| ems_physical_infra_refresh |
| ems_physical_infra_tag |
| ems_physical_infra_view |
| physical_server_view |
| physical_infra_topology_view |
| host_new |
| host_analyze |
| host_compare |
| host_discover |
| host_drift |
| host_edit |
| host_refresh |
| host_show |
| host_show_list |
| host_perf |
| host_tag |
| host_timeline |
| my_settings_default_views |
| my_settings_time_profiles |
| my_settings_visuals |
| miq_report_run |
| miq_report_saved_reports |
| miq_report_schedules |
| miq_report_view |
| miq_task_my_ui |
| miq_template_analyze |
| miq_template_check_compliance |
| miq_template_compare |
| miq_template_drift |
| miq_template_edit |
| miq_template_perf |
| miq_template_refresh |
| miq_template_show |
| miq_template_show_list |
| miq_template_snapshot |
| miq_template_sync |
| miq_template_tag |
| miq_template_timeline |
| pxe |
| resource_pool_show |
| resource_pool_show_list |
| resource_pool_tag |
| service_view |
| provider_foreman_explorer |
| storage_delete |
| storage_scan |
| storage_show |
| storage_show_list |
| storage_perf |
| storage_tag |
| timeline |
| usage |
| vm_analyze |
| vm_check_compliance |
| vm_collect_running_processes |
| vm_compare |
| vm_console |
| vm_webmks_console |
| vm_cloud_explorer |
| vm_explorer |
| vm_infra_explorer |
| vm_vnc_console |
| vm_vmrc_console |
| cockpit_console |
| vm_drift |
| vm_edit |
| vm_perf |
| vm_refresh |
| vm_reset |
| vm_guest_restart |
| vm_show |
| vm_show_list |
| vm_guest_shutdown |
| vm_snapshot |
| vm_start |
| vm_stop |
| vm_suspend |
| vm_pause |
| vm_shelve |
| vm_shelve_offload |
| vm_sync |
| vm_tag |
| vm_timeline |
| vm_chargeback |
| sui_services_view |
| sui_vm_details_view |
| sui_vm_console |
| sui_vm_web_console |
| sui_vm_tags |
| sui_vm_start |
| sui_vm_stop |
| sui_vm_suspend |
| sui_notifications |
EvmRole-operator
EvmRole-security
The EvmRole-security is granted access to the following product
features.
| Product Feature |
|---|
| about |
| all_vm_rules |
| compute |
| chargeback |
| chargeback_reports |
| control_explorer |
| dashboard |
| datastore |
| ems_cluster_show |
| ems_cluster_show_list |
| ems_cluster_perf |
| ems_cluster_tag |
| ems_cluster_timeline |
| ems_infra_show |
| ems_infra_show_list |
| ems_infra_tag |
| ems_infra_timeline |
| ems_physical_infra_tag |
| ems_physical_infra_view |
| physical_server_timeline |
| host_show |
| host_show_list |
| host_perf |
| host_tag |
| host_timeline |
| my_settings_default_views |
| my_settings_time_profiles |
| my_settings_visuals |
| miq_report_run |
| miq_report_saved_reports |
| miq_report_schedules |
| miq_report_view |
| miq_task_my_ui |
| miq_template_check_compliance |
| miq_template_compare |
| miq_template_drift |
| miq_template_perf |
| miq_template_policy_sim |
| miq_template_show |
| miq_template_show_list |
| miq_template_snapshot_add |
| miq_template_snapshot_delete |
| miq_template_snapshot_delete_all |
| miq_template_snapshot_revert |
| miq_template_tag |
| miq_template_timeline |
| policy_log |
| policy_simulation |
| resource_pool_show |
| resource_pool_show_list |
| resource_pool_tag |
| service_view |
| storage_show |
| storage_show_list |
| storage_perf |
| storage_tag |
| timeline |
| usage |
| vm_check_compliance |
| vm_compare |
| vm_drift |
| vm_cloud_explorer |
| vm_explorer |
| vm_infra_explorer |
| vm_perf |
| vm_policy_sim |
| vm_show |
| vm_show_list |
| vm_snapshot_add |
| vm_snapshot_delete |
| vm_snapshot_delete_all |
| vm_snapshot_revert |
| vm_tag |
| vm_timeline |
| vm_chargeback |
| sui_services_view |
| sui_vm_details_view |
| sui_vm_snapshot_create |
| sui_vm_snapshot_delete |
| sui_vm_tags |
| sui_notifications |
EvmRole-security
EvmRole-support
The EvmRole-support is granted access to the following product
features.
| Product Feature |
|---|
| about |
| all_vm_rules |
| compute |
| chargeback |
| chargeback_reports |
| control_explorer |
| dashboard |
| datastore |
| ems_cluster_show |
| ems_cluster_show_list |
| ems_cluster_perf |
| ems_cluster_tag |
| ems_cluster_timeline |
| ems_infra_show |
| ems_infra_show_list |
| ems_infra_tag |
| ems_infra_timeline |
| ems_physical_infra_console |
| ems_physical_infra_tag |
| ems_physical_infra_view |
| host_show |
| host_show_list |
| host_perf |
| host_tag |
| host_timeline |
| miq_task_my_ui |
| my_settings_default_views |
| my_settings_time_profiles |
| my_settings_visuals |
| miq_report_run |
| miq_report_saved_reports |
| miq_report_schedules |
| miq_report_view |
| miq_template_check_compliance |
| miq_template_compare |
| miq_template_drift |
| miq_template_perf |
| miq_template_policy_sim |
| miq_template_show |
| miq_template_show_list |
| miq_template_snapshot |
| miq_template_tag |
| miq_template_timeline |
| physical_infra_topology_view |
| physical_server_view |
| policy_log |
| policy_simulation |
| resource_pool_show |
| resource_pool_show_list |
| resource_pool_tag |
| service_view |
| storage_show |
| storage_show_list |
| storage_perf |
| storage_tag |
| timeline |
| usage |
| vm_check_compliance |
| vm_collect_running_processes |
| vm_console |
| vm_webmks_console |
| vm_cloud_explorer |
| vm_explorer |
| vm_infra_explorer |
| vm_vnc_console |
| vm_vmrc_console |
| cockpit_console |
| vm_compare |
| vm_drift |
| vm_perf |
| vm_policy_sim |
| vm_show |
| vm_show_list |
| vm_snapshot |
| vm_tag |
| vm_timeline |
| vm_chargeback |
| sui_services_view |
| sui_vm_details_view |
| sui_vm_console |
| sui_vm_web_console |
| sui_vm_tags |
| sui_notifications |
EvmRole-support
EvmRole-user
The EvmRole-user is granted access to the following product features.
| Product Feature |
|---|
| about |
| all_vm_rules |
| compute |
| chargeback |
| chargeback_reports |
| dashboard |
| datastore |
| ems_cluster_show |
| ems_cluster_show_list |
| ems_cluster_perf |
| ems_cluster_tag |
| ems_cluster_timeline |
| ems_infra_show |
| ems_infra_show_list |
| ems_infra_tag |
| ems_infra_timeline |
| ems_physical_infra_console |
| ems_physical_infra_show |
| ems_physical_infra_show_list |
| ems_physical_infra_tag |
| ems_physical_infra_timeline |
| host_show |
| host_show_list |
| host_perf |
| host_tag |
| host_timeline |
| miq_task_my_ui |
| my_settings_default_views |
| my_settings_time_profiles |
| my_settings_visuals |
| miq_report_run |
| miq_report_saved_reports |
| miq_report_schedules |
| miq_report_view |
| miq_request_admin |
| miq_request_view |
| miq_template_check_compliance |
| miq_template_compare |
| miq_template_drift |
| miq_template_perf |
| miq_template_show |
| miq_template_show_list |
| miq_template_snapshot |
| miq_template_tag |
| miq_template_timeline |
| physical_infra_topology_view |
| physical_server_view |
| resource_pool_show |
| resource_pool_show_list |
| resource_pool_tag |
| service_view |
| storage_show |
| storage_show_list |
| storage_perf |
| storage_tag |
| timeline |
| usage |
| vm_check_compliance |
| vm_console |
| vm_webmks_console |
| vm_cloud_explorer |
| vm_explorer |
| vm_infra_explorer |
| vm_vnc_console |
| vm_vmrc_console |
| cockpit_console |
| vm_compare |
| vm_drift |
| vm_perf |
| vm_show |
| vm_show_list |
| vm_snapshot |
| vm_tag |
| vm_timeline |
| vm_chargeback |
| sui_services_view |
| sui_vm_details_view |
| sui_vm_console |
| sui_vm_web_console |
| sui_vm_tags |
| sui_orders_view |
| sui_orders_operations |
| sui_notifications |
EvmRole-user
EvmRole-user_limited_self_service
The EvmRole-user_limited_self_service is granted access to the
following product features.
| Product Feature |
|---|
| about |
| all_vm_rules |
| catalog_items_view |
| compute |
| miq_request_admin |
| miq_request_view |
| my_settings_default_views |
| my_settings_visuals |
| service_edit |
| service_delete |
| service_reconfigure |
| service_tag |
| service_retire_now |
| service_view |
| svc_catalog_provision |
| vm_clone |
| vm_cloud_explorer |
| vm_filter_accord |
| vm_guest_restart |
| vm_guest_shutdown |
| vm_infra_explorer |
| vm_miq_request_new |
| vm_publish |
| vm_reset |
| vm_retire_now |
| vm_show |
| vm_show_list |
| vm_snapshot_view |
| vm_start |
| vm_stop |
| vm_suspend |
| vm_pause |
| vm_shelve |
| vm_shelve_offload |
| vm_tag |
| sui_core |
| sui_services |
| sui_vm |
| sui_orders |
| sui_svc_catalog_view |
| sui_svc_catalog_cart |
| sui_cart |
EvmRole-user_limited_self_service
EvmRole-user_self_service
The EvmRole-user_self_service is granted access to the following
product features.
| Product Feature |
|---|
| about |
| all_vm_rules |
| automation_manager |
| embedded_automation_manager |
| ems_physical_infra_console |
| catalog_items_view |
| compute |
| miq_template_clone |
| miq_template_drift |
| miq_template_edit |
| miq_template_perf |
| miq_template_refresh |
| miq_template_show |
| miq_template_show_list |
| miq_template_snapshot |
| miq_template_sync |
| miq_template_tag |
| miq_template_timeline |
| my_settings_default_views |
| my_settings_visuals |
| miq_request_admin |
| miq_request_view |
| provider_foreman_explorer |
| service_edit |
| service_delete |
| service_reconfigure |
| service_tag |
| service_retire_now |
| service_view |
| svc_catalog_provision |
| vm_console |
| vm_webmks_console |
| vm_clone |
| vm_cloud_explorer |
| vm_console |
| vm_webmks_console |
| vm_drift |
| vm_edit |
| vm_filter_accord |
| vm_guest_restart |
| vm_guest_shutdown |
| vm_infra_explorer |
| vm_miq_request_new |
| vm_perf |
| vm_publish |
| vm_refresh |
| vm_reset |
| vm_retire_now |
| vm_show |
| vm_show_list |
| vm_snapshot |
| vm_start |
| vm_stop |
| vm_suspend |
| vm_pause |
| vm_shelve |
| vm_shelve_offload |
| vm_sync |
| vm_tag |
| vm_timeline |
| vm_chargeback |
| vm_vmrc_console |
| vm_vnc_console |
| cockpit_console |
| sui |
EvmRole-user_self_service
EvmRole-vm_user
The EvmRole-vm_user is granted access to the following product
features.
| Product Feature |
|---|
| about |
| all_vm_rules |
| automation_manager |
| embedded_automation_manager |
| compute |
| miq_request_admin |
| miq_request_view |
| miq_template_analyze |
| miq_template_check_compliance |
| miq_template_clone |
| miq_template_drift |
| miq_template_edit |
| miq_template_perf |
| miq_template_show |
| miq_template_show_list |
| miq_template_snapshot |
| miq_template_sync |
| miq_template_tag |
| miq_template_timeline |
| my_settings_default_views |
| my_settings_visuals |
| provider_foreman_explorer |
| vm_analyze |
| vm_check_compliance |
| vm_clone |
| vm_cloud_explorer |
| vm_collect_running_processes |
| vm_compare |
| vm_console |
| vm_webmks_console |
| vm_drift |
| vm_explorer |
| vm_guest_restart |
| vm_guest_shutdown |
| vm_infra_explorer |
| vm_miq_request_new |
| vm_perf |
| vm_policy_sim |
| vm_publish |
| vm_refresh |
| vm_reset |
| vm_retire_now |
| vm_show |
| vm_show_list |
| vm_snapshot |
| vm_start |
| vm_stop |
| vm_suspend |
| vm_pause |
| vm_shelve |
| vm_shelve_offload |
| vm_sync |
| vm_tag |
| vm_timeline |
| vm_chargeback |
| vm_vmrc_console |
| vm_vnc_console |
| cockpit_console |
| sui_vm_details_view |
| sui_vm_console |
| sui_vm_web_console |
| sui_vm_tags |
| sui_vm_retire |
| sui_vm_start |
| sui_vm_stop |
| sui_vm_suspend |
| sui_orders_view |
| sui_orders_operations |
| sui_notifications |
EvmRole-vm_user
EvmRole-tenant_administrator
The EvmRole-tenant_administrator is granted access to the following
product features.
| Product Feature |
|---|
| about |
| automation_manager |
| embedded_automation_manager |
| availability_zone |
| host_aggregate |
| all_vm_rules |
| compute |
| cloud_network |
| cloud_subnet |
| flavor |
| floating_ip |
| chargeback |
| catalog |
| cloud_tenant |
| control_explorer |
| dashboard |
| datacenter |
| storage |
| ems_cloud |
| ems_network |
| ems_cluster |
| ems_infra |
| ems_physical_infra |
| host |
| load_balancer |
| miq_ae_class_explorer |
| miq_ae_customization_explorer |
| miq_ae_class_import_export |
| miq_ae_class_log |
| miq_ae_class_simulation |
| miq_task_all_ui |
| miq_task_my_ui |
| my_settings |
| network_port |
| network_router |
| policy_simulation |
| policy_log |
| miq_report |
| miq_request |
| miq_template |
| orchestration_stack |
| planning |
| policy_import_export |
| provider_foreman_explorer |
| pxe |
| rbac_group |
| rbac_role_view |
| rbac_tenant |
| rbac_user |
| resource_pool |
| security_group |
| service |
| timeline |
| usage |
| utilization |
| vm_explorer |
| vm |
| vm_cloud_explorer |
| vm_infra_explorer |
| sui_services |
| sui_notifications |
EvmRole-tenant_administrator
EvmRole-tenant_quota_administrator
The EvmRole-tenant_quota_administrator is granted access to the
following product features.
| Product Feature |
|---|
| about |
| automation_manager |
| embedded_automation_manager |
| availability_zone |
| host_aggregate |
| all_vm_rules |
| flavor |
| compute |
| chargeback |
| catalog |
| cloud_tenant |
| control_explorer |
| dashboard |
| datacenter |
| storage |
| ems_cloud |
| ems_cluster |
| ems_infra |
| ems_physical_infra |
| host |
| miq_ae_class_explorer |
| miq_ae_customization_explorer |
| miq_ae_class_import_export |
| miq_ae_class_log |
| miq_ae_class_simulation |
| miq_task_all_ui |
| miq_task_my_ui |
| my_settings |
| policy_simulation |
| policy_log |
| miq_report |
| miq_request |
| miq_template |
| orchestration_stack |
| planning |
| policy_import_export |
| provider_foreman_explorer |
| pxe |
| rbac_tenant_view |
| rbac_tenant_manage_quotas |
| resource_pool |
| security_group |
| service |
| timeline |
| usage |
| utilization |
| vm_explorer |
| vm |
| vm_cloud_explorer |
| vm_infra_explorer |
| sui_services |
| sui_notifications |
EvmRole-tenant_quota_administrator
EvmRole-consumption_administrator
The EvmRole-consumption_administrator is granted access to the
following product features.
| Product Feature |
|---|
| dashboard |
| chargeback |
| miq_report |
EvmRole-consumption_administrator
EvmRole-container_administrator
The EvmRole-container_administrator is granted access to the following
product features.
| Product Feature |
|---|
| vms_filter_accord |
| instances_filter_accord |
| datacenter_controller |
| storage |
| storage_pod |
| dashboard |
| miq_report |
| consumption |
| chargeback |
| pictures |
| control_explorer |
| generic_object |
| generic_object_definition |
| my_settings |
| tasks |
| about |
| ems_container |
| container_group |
| container_node |
| container_replicator |
| container_image |
| container_image_registry |
| persistent_volume |
| container_build |
| container_template |
| container_service |
| container_route |
| container_project |
| container |
| container_topology |
| container_dashboard |
| ems_infra_dashboard |
| instance_view |
| vm_view |
| miq_cloud_networks |
| miq_arbitration_settings |
| miq_arbitration_rules |
| redhat_access_insights_admin |
| ems_container_ad_hoc_metrics |
| monitor |
| monitor_alerts |
| alert_status |
| alert_action |
| ems_infra |
| rbac_user |
| ops_settings |
EvmRole-container_administrator
EvmRole-container_operator
The EvmRole-container_operator is granted access to the following
product features.
| Product Feature |
|---|
| vms_filter_accord |
| instances_filter_accord |
| dashboard_view |
| miq_report_saved_reports_view |
| miq_report_view |
| miq_report_control |
| chargeback_reports |
| my_settings |
| tasks |
| ems_container_view |
| ems_container_check_compliance |
| container_group_view |
| container_group_check_compliance |
| container_node_view |
| container_node_check_compliance |
| container_replicator_check_compliance |
| container_image_view |
| container_image_scan |
| container_image_check_compliance |
| container_image_registry_view |
| persistent_volume_view |
| container_build_view |
| container_template_view |
| container_service_view |
| container_route_view |
| container_project_view |
| container_filter_accord |
| container_view |
| container_control |
| container_topology |
| container_dashboard |
| instance_view |
| vm_view |
| ems_container_ad_hoc_metrics |
| monitor |
| monitor_alerts |
| alert_status |
| alert_action |
| ems_infra |
| rbac_user |
| ops_settings |
EvmRole-container_operator
EvmRole-reader
The EvmRole-reader is granted access to the following product
features.
| Product Feature |
|---|
| auth_key_pair_cloud_view |
| automation_manager_configuration_script_view |
| automation_manager_configured_system_view |
| automation_manager_providers_view |
| availability_zone_view |
| catalog_items_view |
| cloud_network_view |
| cloudobject_store_container_view |
| cloud_object_store_object_view |
| cloud_subnet_view |
| cloud_tenant_view |
| cloud_topology |
| cloud_volume_backup_view |
| cloud_volume_snapshot_view |
| cloud_volume_view |
| configuration_job_view |
| configuration_script_view |
| configured_systems_filter_accord_view |
| container_build_view |
| container_dashboard |
| container_filter_accord |
| container_group_view |
| container_image_registry_view |
| container_image_view |
| container_node_view |
| container_project_view |
| container_replicator_view |
| container_route_view |
| container_service_view |
| container_template_view |
| container_topology |
| container_view |
| customization_template_view |
| dashboard_view |
| embedded_automation_manager_credentials_view |
| embedded_configuration_script_payload_view |
| embedded_configuration_script_source_view |
| ems_block_storage_view |
| ems_cloud_view |
| ems_cluster_view |
| ems_container_view |
| ems_infra_view |
| ems_physical_infra_view |
| ems_network_view |
| ems_object_storage_view |
| flavor_view |
| floating_ip_view |
| host_aggregate_view |
| host_view |
| image_view |
| infra_networking_view |
| infra_topology |
| instance_view |
| iso_datastore_view |
| load_balancer_view |
| miq_ae_class_log |
| miq_ae_domain_view |
| miq_report_saved_reports_view |
| miq_report_schedule_view |
| miq_report_view |
| miq_request_view |
| miq_template_snapshot_view |
| miq_template_view |
| my_settings |
| network_port_view |
| network_router_view |
| network_topology |
| orchestration_stack_view |
| orchestration_templates_view |
| persistent_volume_view |
| physical_infra_topology_view |
| physical_server_view |
| planning |
| policy_log |
| provider_foreman_view |
| pxe_image_type_view |
| pxe_server_view |
| rbac_group_view |
| rbac_role_view |
| rbac_tenant_view |
| rbac_user_view |
| redhat_access_insights_overview |
| resource_pool_view |
| security_group_view |
| service_view |
| st_catalog_view |
| storage_view |
| tasks |
| timeline |
| utilization |
| virtual_template_show |
| vm_cloud_explorer |
| vm_explorer |
| vm_infra_explorer |
| vm_snapshot_view |
| vm_view |
| sui_services_view |
| sui_orders_view |
| sui_notifications |
EvmRole-reader