
Troubleshooting
Logging
ManageIQ has extensive logging to assist in troubleshooting issues or just seeing what is being worked on.
Appliance Logging
Viewing Logs
On appliances logging is managed using the built-in systemd-journal system. Journald uses database-like binary files to store log lines along with extensive metadata.
There is a journalctl command-line utility which can be used to query the journal. Documentation for journalctl can be found at https://man7.org/linux/man-pages/man1/journalctl.1.html
If you want to tail the main evm logs then you can use journalctl -f -t evm. Other logs (e.g.: automation or api) can be viewed by using their syslog_identifier e.g. journalctl -f -t automation. You can also view multiple logs by using journalctl -f -t evm -t automation -t api.
journalctl allows you to do much more like view logs for a specific unit (aka worker), for a time range, and for a group of workers (e.g. every generic worker).
Here are some helpful examples:
Viewing:
- View all logs:
journalctl - View all logs, most recent first:
journalctl -r - View all logs since the last boot:
journalctl -b - View all logs from the previous boot:
journalctl -b -1 - View all logs from a time range:
journalctl --since "1 hour ago" - View all logs with extra metadata:
journalctl --output verbose - Tail all logs:
journalctl -f
Filtering:
- Filter warnings:
journalctl -f -p warning - Filter errors:
journalctl -f -p err - Filter warnings and errors:
journalctl -f -p err -p warning - Logs for a specific unit:
journalctl -f -u manageiq-generic@51113329-8942-4a4c-98d6-1e532656c569.service - Logs for a group of workers:
journalctl -f -u manageiq-generic.slice - Logs matching a pattern:
journalctl -g '(Started|Stopping) EVM server''(accepts perl compatible regular expressions) - Logs for a specific identifier:
journalctl -f -t evm
Other:
- Export to a file:
journalctl --output export > export.log - Rotate the current journal to an archive:
journalctl --rotate - Clear out all archived journals:
journalctl --vacuum-time=1s - Clear out journal archives over a day old:
journalctl --vacuum-time=1d
Almost all of these can be combined together where they don’t conflict (e.g. -f can’t be used with -r)
Collecting Logs
If you have to collect logs from appliances for diagnostic purposes there are a couple utilities that are provided for this purpose.
To collect logs from only a single appliance you can use collect_current_logs.sh or collect_archive_logs.sh. To use these utilities you should ssh to the appliance and cd /var/www/miq/vmdb/tools/collect_logs directory.
Now run ./collect_current_logs.sh or ./collect_archive_logs.sh depending on if you want the latest or all logs.
The output will be in /var/www/miq/vmdb/log/evm_current_HOSTNAME_TIMESTAMP.tar.xz or /var/www/miq/vmdb/log/evm_archive_HOSTNAME_TIMESTAMP.tar.xz
To collect logs from all appliances in the region over ssh we provide a collect_all_logs utility. This iterates over all MiqServer records in the region and collects the output of collect_current_logs.sh rolled up into a single .tar.xz file.
Podified Logging
When running in podified all logs are output to the container’s stdout which is picked up by Kubernetes/OpenShift and made available via kubectl logs/oc logs.
The log output format is in JSON and includes extra metadata like the log-level, timestamp:
{
  "@timestamp":"2020-01-01T12:34:56.789012",
  "pid":12345,
  "tid":"6789abcdef01",
  "level":"info",
  "message":"MIQ(Class#method) Example message"
}
You can also pass a label selector to oc logs with -l so for example to tail all generic pods: oc logs -f -l name=1-generic
If you prefer to view the container JSON logs in the standard MIQ format you can use the unjson_logs utility. This utility is in /var/www/miq/vmdb/tools/unjson_logs
oc logs -l name=1-ui | tools/unjson_logs
[----] I, [2022-06-16T15:40:21.095098 #7:b4e4c]  INFO -- production: Started GET "/ems_infra/56?display=vms" for 127.0.0.1 at 2022-06-16 15:40:21 +0000
[----] I, [2022-06-16T15:40:21.100999 #7:b4e4c]  INFO -- production: Processing by EmsInfraController#show as HTML
[----] I, [2022-06-16T15:40:21.101242 #7:b4e4c]  INFO -- production:   Parameters: {"display"=>"vms", "id"=>"56"}
Providers
VMware vCenter Provider
If you are having issues with a VMware provider you can enable extensive debug logging which will log the raw XML payloads for all requests and responses between the vCenter and ManageIQ.
There are two settings that you have to enable in Advanced Settings
- log.level_vim must be set to debug
- ems.ems_vmware.debug_vim_requests must be set to true
With these two settings enabled you will see the full XML payloads in the vim log, here is a sample Login action:
[----] D, [2024-12-04T12:31:51.307304#554036:97f4] DEBUG -- vim: <?xml version='1.0' ?>
<env:Envelope xmlns:xsi="http://www.w3.org/2001/XMLSchema-instance" xmlns:env="http://schemas.xmlsoap.org/soap/envelope/">
  <env:Header />
  <env:Body>
    <n1:Login xmlns:n1="urn:vim25">
      <n1:_this type="SessionManager">SessionManager</n1:_this>
      <n1:userName>user</n1:userName>
      <n1:password>pass</n1:password>
    </n1:Login>
  </env:Body>
</env:Envelope>
[----] D, [2024-12-04T12:31:51.308114#554036:97f4] DEBUG -- vim: <?xml version="1.0" encoding="UTF-8"?>
<soapenv:Envelope xmlns:soapenc="http://schemas.xmlsoap.org/soap/encoding/" xmlns:soapenv="http://schemas.xmlsoap.org/soap/envelope/" xmlns:xsd="http://www.w3.org/2001/XMLSchema" xmlns: xsi="http://www.w3.org/2001/XMLSchema-instance">
  <soapenv:Body>
    <LoginResponse xmlns="urn:vim25">
      <returnval>
        <key>53e7183f-4db3-4e02-b62d-840b9a47fc31</key>
        <userName>user</userName>
        <fullName>user</fullName>
        <loginTime>2024-12-04T17:31:51.307621525Z</loginTime>
        <lastActiveTime>2024-12-04T12:31:51.307628585-05:00</lastActiveTime>
        <locale>en_US</locale>
        <messageLocale>en_US</messageLocale>
        <extensionSession>false</extensionSession>
        <ipAddress>127.0.0.1</ipAddress>
        <userAgent>HTTPClient/1.0 (2.8.3, ruby 3.3.5 (2024-09-03))</userAgent>
        <callCount>1</callCount>
      </returnval>
    </LoginResponse>
  </soapenv:Body>
</soapenv:Envelope>
Depending on the payloads you are working with, they might overflow the journald LineMax and be cut off.
If this is the case you can edit the /etc/systemd/journald.conf file and adjust the LineMax setting appropriately.
Disabling a Feature Across All User Interfaces
Overview
A feature in ManageIQ (such as retiring a service) may have separate feature identifiers for each user interface: the standard UI, Service UI, and API. Disabling a feature identifier in one user interface does not disable the feature in other user interfaces. To fully disable a feature, all of its feature identifiers must be disabled.
Background
When you edit a user role in Access Control → Roles, you see a tree of feature identifiers. However, this tree doesn’t show which identifiers belong to the same feature across different user interfaces. The API configuration in api.yml maps each feature to its related identifiers. If a user has any of the identifiers listed for a feature, the API request succeeds.
Example: Service Retirement Feature
Consider the service retirement feature, which has two distinct feature identifiers:
API Configuration
From config/api.yml:
- :name: retire
  :identifier:
  - service_retire_now
  - sui_services_retire
Feature Identifier Definitions
Standard UI Feature Identifier - miq_product_features.yml:
- :name: Retire Services
  :description: Retire Services
  :feature_type: control
  :identifier: service_retire_now
Service UI Feature Identifier - miq_product_features.yml:
- :name: Retire Service
  :description: Retire Service
  :feature_type: control
  :identifier: sui_services_retire
Implications for Disabling Features
Disabling a feature identifier restricts access in its corresponding user interface (standard UI or Service UI), but does not disable the feature in other user interfaces. Since the API accepts any of the listed feature identifiers, all identifiers must be disabled to fully disable the feature across all user interfaces.
How to Disable a Feature Across All User Interfaces
To fully disable a feature:
- Check the main features section - Navigate to Access Control → Roles → Your custom role and locate the relevant feature permissions in the features tree. For example, Everything → Services → My Services → Operate → Retire Services.
- Check the Service UI section - Also review the Service UI section of the features tree, as some features have additional permissions for other user interfaces that must be disabled. For example, Everything → Service UI → My Services → Operate → Retire Service.
- Disable all related permissions - Disable permissions in both sections (e.g., for service retirement, disable both the main service retirement permission and the Service UI retirement permission)
- Verify - Test requests across all interfaces (standard UI, Service UI, and API) and confirm access is denied
Visual Reference
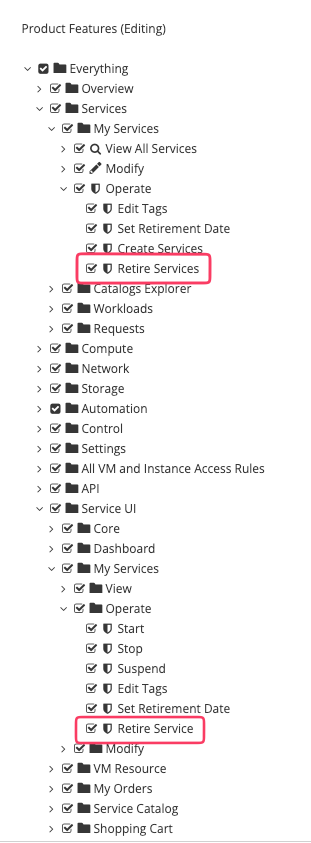
The screenshot shows two separate “Retire Service” feature identifiers—one under Services and one under Service UI. Both must be disabled to disable the feature across all user interfaces.
Features with Multiple Identifiers
Features with multiple feature identifiers include:
- Service retirement
- Service creation
- Service modification
- Custom button actions
- Other operations with both standard and Service UI identifiers