- QuickStart Guide for ManageIQ with Red Hat OpenStack Platform
- Introduction to ManageIQ
- Key ManageIQ Features for OpenStack Cloud Providers
- Installing and Configuring ManageIQ
- Adding an OpenStack Infrastructure Provider
- Adding an OpenStack Cloud Provider
- Performing a SmartState Analysis
- Using the Topology Widget
- Managing Policies
- Managing Instances
- Managing Storage
- Catalogs and Services
- Reports
- Chargeback
- Using a Self-Signed CA Certificate
- Customizing Provisioning Dialogs
- Creating Custom Buttons for Cloud Tenants
- Creating a Custom Button Group
- Creating a Custom Button
- Managing Keypairs
QuickStart Guide for ManageIQ with Red Hat OpenStack Platform
Introduction to ManageIQ
ManageIQ delivers the insight, control, and automation that enterprises need to address the challenges of managing virtual environments. This technology enables enterprises with existing virtual infrastructures to improve visibility and control, and those starting virtualization deployments to build and operate a well-managed virtual infrastructure.
ManageIQ provides the following feature sets:
-
Insight: Discovery, Monitoring, Utilization, Performance, Reporting, Analytic, Chargeback, and Trending.
-
Control: Security, Compliance, Alerting, and Policy-Based Resource, and Configuration Enforcement.
-
Automate: IT Process, Task and Event, Provisioning, and Workload Management and Orchestration.
-
Integrate: Systems Management, Tools and Processes, Event Consoles, Configuration Management Database (CMDB), Role-based Administration (RBA), and Web Services.
Architecture
The diagram below describes the capabilities of ManageIQ. Its
features are designed to work together to provide robust management and
maintenance of your virtual infrastructure. 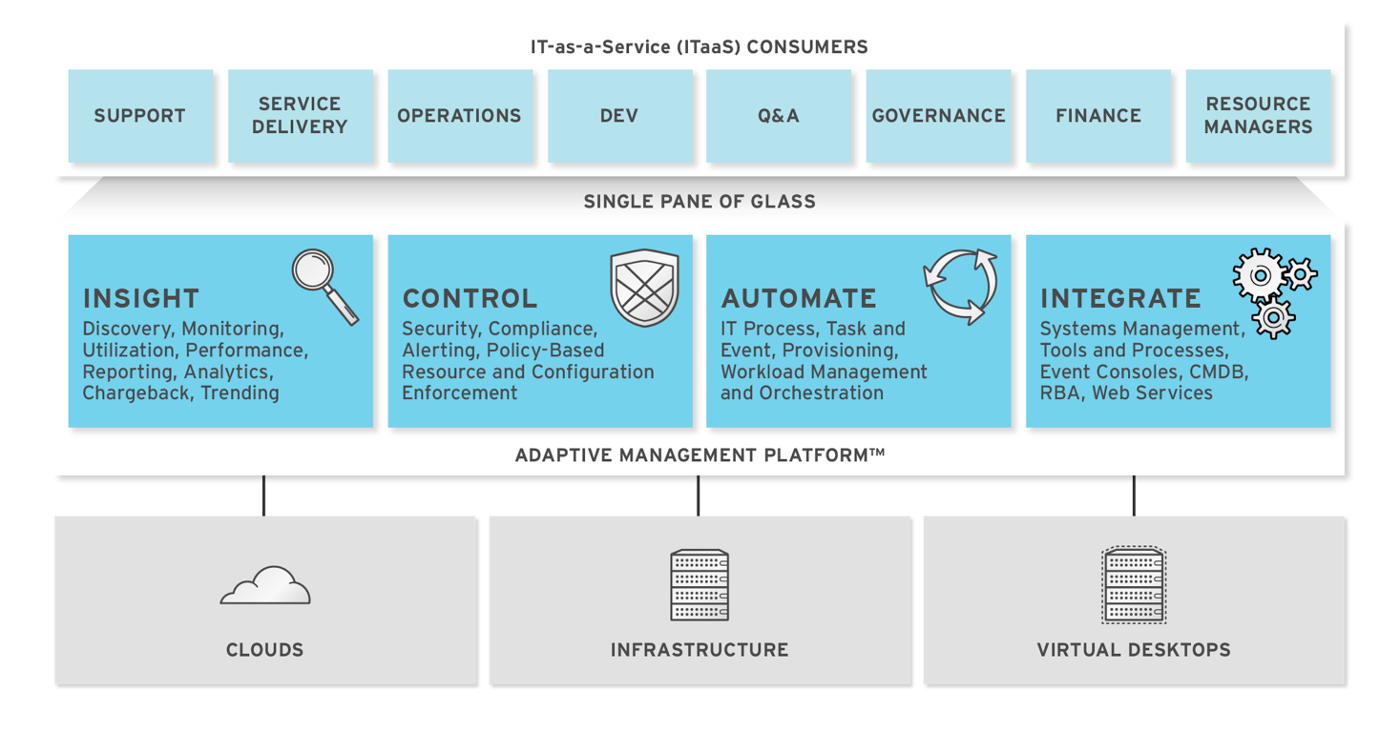
The architecture comprises the following components:
-
The ManageIQ appliance (appliance) which is supplied as a secure, high-performance, preconfigured virtual machine. It provides support for HTTPS communications.
-
The ManageIQ Server (Server) resides on the appliance. It is the software layer that communicates between the SmartProxy and the Virtual Management Database. It includes support for HTTPS communications.
-
The Virtual Management Database (VMDB) resides either on the appliance or another computer accessible to the appliance. It is the definitive source of intelligence collected about your Virtual Infrastructure. It also holds status information regarding appliance tasks.
-
The ManageIQ Console (Console) is the Web interface used to view and control the Server and appliance. It is consumed through Web 2.0 mash-ups and web services (WS Management) interfaces.
-
The SmartProxy can reside on the appliance or on an ESX Server. If not embedded in the Server, the SmartProxy can be deployed from the appliance. A SmartProxy agent must configured in each storage location, and must be visible to the appliance. The SmartProxy acts on behalf of the appliance communicating with it over HTTPS on standard port 443.
Requirements
To use ManageIQ, certain virtual hardware, database, and browser requirements must be met in your environment.
Virtual Hardware Requirements
The ManageIQ appliance requires the following virtual hardware at minimum:
-
4 VCPUs
-
12 GB RAM
-
44 GB HDD + optional database disk + optional messaging disk
Database Requirements
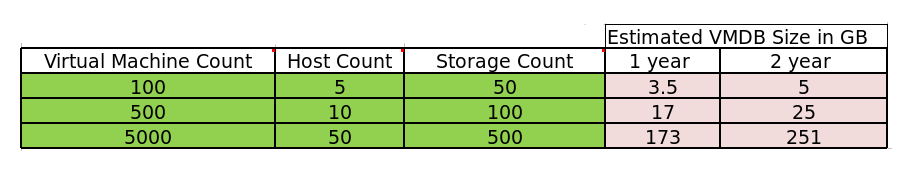
Red Hat recommends allocating the virtual machine disk fully at the time of creation. Three main factors affect the size of your database over time:
-
Virtual Machine Count: the most important factor in the calculation of virtual machine database (VMDB) size over time.
-
Host Count: the number of hosts associated with the provider.
-
Storage Count: the number of individual storage elements as seen from the perspective of the provider or host. It is not the total number of virtual disks for all virtual machines.
Use the following table as a guideline to calculate minimum requirements for your database:
Note:
When enabling capacity and utilization for metrics gathering over a period of time, it is recommended that the VMDB size scale accordingly. Evaluate the number of instances in your provider inventory and storage duration requirements to plan for increased VMDB sizing requirements.
Use the following information to plan for your increased VMDB needs when working with metrics gathering:
-
Realtime metrics data are stored for 4 hours.
-
Rollup metrics data are stored for 6 months.
Example:
| Minute | Hour | Day | |
| OpenStack Provider Instance | 3 Realtime Metrics | 181 (3 records * 60 minutes = 180 Realtime Metrics + 1 hourly Rollup Metric) | 4,345 (3 records * 60 minutes * 24 hours =4320 Realtime Metrics + 1 daily Rollup Metric) |
- Metrics data storage times can be configured by editing the Advanced Settings.
Browser Requirements
To use ManageIQ, the following browser requirements must be met:
-
One of the following web browsers:
-
Google Chrome
-
Mozilla Firefox
-
Safari
-
Internet Explorer 10 or higher
-
Additional Requirements
Additionally, the following must be configured to use ManageIQ:
-
The ManageIQ appliance must already be installed and activated in your enterprise environment.
-
The SmartProxy must have visibility into the virtual machines and cloud instances that you want to control.
-
For more information, see SmartProxies in the ManageIQ General Configuration guide.
Terminology
The following terms are used throughout the documentation. Review them before proceeding.
-
Account Role The level of access a user has to different parts and functions of the ManageIQ console. There are a variety of Account Roles, which can be assigned to users to restrict or allow access to parts of the console and virtual infrastructure.
-
Action An execution that is performed after a condition is evaluated.
-
Alert ManageIQ alerts notify administrators and monitoring systems of critical configuration changes and threshold limits in the virtual environment. The notification can take the form of either an email or an SNMP trap.
-
Analysis Profile A customized scan of hosts, virtual machines, or instances. You can collect information from categories, files, event logs, and registry entries.
-
Cloud A pool of on-demand and highly available computing resources. The usage of these resources are scaled depending on the user requirements and metered for cost.
-
ManageIQ Appliance A virtual machine where the virtual management database (VMDB) and ManageIQ reside.
-
ManageIQ Console A web-based interface into the ManageIQ appliance.
-
ManageIQ Role A designation assigned to a ManageIQ server that defines what a ManageIQ server can do.
-
ManageIQ Server The application that runs on the ManageIQ appliance and communicates with the SmartProxy and the VMDB.
-
Cluster Hosts that are grouped together to provide high availability and load balancing.
-
Condition A control policy test triggered by an event, which determines a subsequent action.
-
Discovery Process run by the ManageIQ server which finds virtual machine and cloud providers.
-
Drift The comparison of a virtual machine, instance, host, cluster to itself at different points in time.
-
Event A trigger to check a condition.
-
Event Monitor Software on the ManageIQ appliance which monitors external providers for events and sends them to the ManageIQ server.
-
Host A computer running a hypervisor, capable of hosting and monitoring virtual machines. Supported hypervisors include RHV-H, VMware ESX hosts, Windows Hyper-V hosts.
-
Instance/Cloud Instance A on-demand virtual machine based upon a predefined image and uses a scalable set of hardware resources such as CPU, memory, networking interfaces.
-
Managed/Registered VM A virtual machine that is connected to a host and exists in the VMDB. Also, a template that is connected to a provider and exists in the VMDB. Note that templates cannot be connected to a host.
-
Managed/Unregistered VM A virtual machine or template that resides on a repository or is no longer connected to a provider or host and exists in the VMDB. A virtual machine that was previously considered registered may become unregistered if the virtual machine was removed from provider inventory.
-
Provider An external management system that ManageIQ integrates in order to collect data and perform operations.
-
Policy A combination of an event, a condition, and an action used to manage a virtual machine.
-
Policy Profile A set of policies.
-
Refresh A process run by the ManageIQ server which checks for relationships of the provider or host to other resources, such as storage locations, repositories, virtual machines, or instances. It also checks the power states of those resources.
-
Regions A region is the collection of zones that share the same database for reporting and charting. A master region may be added to synchronize multiple VMDBs into one VMDB for higher-level reporting, providing a “single pane of glass” view.
-
Resource A host, provider, instance, virtual machine, repository, or datastore.
-
Resource Pool A group of virtual machines across which CPU and memory resources are allocated.
-
Repository A place on a datastore resource which contains virtual machines.
-
SmartProxy The SmartProxy is a software agent that acts on behalf of the ManageIQ appliance to perform actions on hosts, providers, storage and virtual machines.
- The SmartProxy can be configured to reside on the ManageIQ appliance or on an ESX server version. The SmartProxy can be deployed from the ManageIQ appliance, and provides visibility to the VMFS storage. Each storage location must have a SmartProxy with visibility to it. The SmartProxy acts on behalf of the ManageIQ appliance. If the SmartProxy is not embedded in the ManageIQ server, it communicates with the ManageIQ appliance over HTTPS on standard port 443.
-
SmartState Analysis Process run by the SmartProxy which collects the details of a virtual machine or instance. Such details include accounts, drivers, network information, hardware, and security patches. This process is also run by the ManageIQ server on hosts and clusters. The data is stored in the VMDB.
-
SmartTags Descriptors that allow you to create a customized, searchable index for the resources in your clouds and infrastructure.
-
Storage Location A device, such as a VMware datastore, where digital information resides that is connected to a resource.
-
Tags Descriptive terms defined by a ManageIQ user or the system used to categorize a resource.
-
Template A template is a copy of a preconfigured virtual machine, designed to capture installed software and software configurations, as well as the hardware configuration, of the original virtual machine.
-
Unmanaged Virtual Machine Files discovered on a datastore that do not have a virtual machine associated with them in the VMDB. These files may be registered to a provider that the ManageIQ server does not have configuration information on. Possible causes may be that the provider has not been discovered or that the provider has been discovered, but no security credentials have been provided.
-
Virtual Machine A software implementation of a system that functions similar to a physical machine. Virtual machines utilize the hardware infrastructure of a physical host, or a set of physical hosts, to provide a scalable and on-demand method of system provisioning.
-
Virtual Management Database (VMDB) Database used by the ManageIQ appliance to store information about your resources, users, and anything else required to manage your virtual enterprise.
-
Virtual Thumbnail An image in the web interface representing a resource, such as a provider or a virtual machine, showing the resource’s properties at a glance. Each virtual thumbnail is divided into quadrants, which provide information about the resource, such as its software and power state.
-
Worker Appliance A ManageIQ appliance dedicated to a role other than user interface or database.
-
Zones ManageIQ Infrastructure can be organized into zones to configure failover and to isolate traffic. Zones can be created based on your environment. Zones can be based on geographic location, network location, or function. When first started, new servers are put into the default zone.
Key ManageIQ Features for OpenStack Cloud Providers
ManageIQ provides several interface features specific to OpenStack cloud providers:
-
The ManageIQ Topology widget (Using the Topology Widget) provides an interactive visualization of the OpenStack cloud.
-
ManageIQ provides a user interface for managing OpenStack storage resources (Managing Storage).
-
Custom buttons, which allows you to provide automation for specific actions to OpenStack tenants. See Creating Custom Buttons for Cloud Tenants.
When adding an OpenStack cloud provider, you can also:
-
Enable tenant mapping. This creates a one-to-one association between tenants in ManageIQ and OpenStack.
-
Connect to OpenStack through the Keystone V3 API. This API enables multiple OpenStack identity domains. Domains are high-level containers for projects, users, and groups. Users of different domains can be represented in different authentication back ends.
For information about tenant mapping and the Keystone V3 API, see Adding an OpenStack Cloud Provider.
Installing and Configuring ManageIQ
ManageIQ can be installed on a number of virtualization platforms, such as VMware vSphere, and Red Hat Enterprise Virtualization. This chapter describes how to install and configure ManageIQ on Red Hat OpenStack Platform.
Obtaining and Installing the ManageIQ Appliance
First, download the appliance:
Afterwards, upload or install the appliance image as a virtual machine or instance on a supported virtualization environment or cloud provider. See the Installation and Upgrade section for information on different supported ManageIQ deployment methods.
Whichever deployment method you choose, ensure that ManageIQ is configured with connectivity to the OpenStack management network.
Tip:
See Uploading the Appliance on OpenStack for instructions on deploying ManageIQ as an instance on the overcloud.
Configuring ManageIQ
After deploying the appliance, log in with the root password smartvm.
If you deployed the appliance as a virtual machine, you can log in
through virsh:
[root@kvm-host ~]# virsh console my-cfme
Connected to domain my-cfme
...
Welcome to the CFME Virtual Appliance.

You can browse to http://localhost.localdomain/

Red Hat Enterprise Linux Server 7.2 (Maipo)
Kernel 3.10.0-327.36.1.el7.x86_64 on an x86_64
localhost login: root
Password:
Last login: Thu Oct 13 23:03:53 on tty2
Welcome to the Appliance Console

For a menu, please type: appliance_console
[root@localhost ~]#
Configuring General Appliance Settings
After logging in, you can use the following menu items for advanced configuration of the appliance:
Option |
Description |
Configure Network |
Provides options for configuring the network for your ManageIQ appliance. The appliance is initially configured as a DHCP client with bridged networking. You can use DHCP to obtain the IP address and network configuration for your ManageIQ appliance, or use an IPv4 or IPv6 static network configuration by providing specific IP address and network settings. This menu also provides options to test the network configuration to check that name resolution is working correctly, and to set the appliance’s host name. A valid fully qualified hostname for the ManageIQ appliance is required for SmartState analysis to work correctly. |
Restore Database from Backup |
Restore the Virtual Management Database (VMDB) from a previous backup. |
Configure Application |
Configure the VMDB and Kafka. Use this option to configure the database and messaging for the appliance after installing and running it for the first time. |
Configure Database Replication |
Configure a primary or standby server for VMDB replication. |
Logfile Configuration |
Provides options for configuring a new logfile disk volume, and changing the saved logrotate count. |
Configure Application Database Failover Monitor |
Start or stop VMDB failover monitoring. |
Extend Temporary Storage |
Add temporary storage to the appliance. The appliance formats an unpartitioned disk attached to the appliance host and mounts it at |
Configure External Authentication (httpd) |
Configure authentication through an IPA server. |
Update External Authentication Options |
Enable or disable external authentication methods: single sign-on, SAML, and local login. For example, if the current state is |
Generate Custom Encryption Key |
Regenerate the encryption key used to encode plain text password. |
Harden Appliance Using SCAP Configuration |
Apply Security Content Automation Protocol (SCAP) standards to the appliance. You can view these SCAP rules in the |
Stop EVM Server Processes |
Stop all server processes. You may need to do this to perform maintenance. |
Start EVM Server Processes |
Start the server. You may need to do this after performing maintenance. |
Restart Appliance |
Restart the ManageIQ appliance. You can either restart the appliance and clear the logs or just restart the appliance. |
Shut Down Appliance |
Power down the appliance and exit all processes. |
Summary Information |
Go back to the network summary screen for the ManageIQ appliance. |
Quit |
Leave the ManageIQ appliance console. |
Configuring a Database
ManageIQ uses a database to store information about the environment. Before using ManageIQ, configure the database options for it; ManageIQ provides the following two options for database configuration:
Configuring an Internal Database
Before installing an internal database, add a disk to the infrastructure hosting your appliance. See the documentation specific to your infrastructure for instructions for adding a disk. As a storage disk usually cannot be added while a virtual machine is running, Red Hat recommends adding the disk before starting the appliance. ManageIQ only supports installing of an internal VMDB on blank disks; installation will fail if the disks are not blank.
-
Start the appliance and open a terminal console.
-
Enter the
appliance_consolecommand. The ManageIQ appliance summary screen displays. -
Press Enter to manually configure settings.
-
Select Configure Application from the menu.
-
You are prompted to create or fetch an encryption key.
-
If this is the first ManageIQ appliance, choose Create key.
-
If this is not the first ManageIQ appliance, choose Fetch key from remote machine to fetch the key from the first appliance. For worker and multi-region setups, use this option to copy key from another appliance.
Note: All ManageIQ appliances in a multi-region deployment must use the same key.
-
-
Choose Create Internal Database for the database location.
In the Configure Messaging menu, select Make No messaging changes. If you see
Configuration failed: Internal database require a volume mounted at /var/lib/pgsql. Please add an unpartitioned disk and try again.message, then ensure to add a second disk for the database per instructions as defined above. -
Choose a disk for the database. This can be either a disk you attached previously, or a partition on the current disk.
Red Hat recommends using a separate disk for the database.If there is an unpartitioned disk attached to the virtual machine, the dialog will show options similar to the following:
1) /dev/vdb: 20480 2) Don't partition the disk-
Enter 1 to choose
/dev/vdbfor the database location. This option creates a logical volume using this device and mounts the volume to the appliance in a location appropriate for storing the database. The default location is/var/lib/pgsql, which can be found in the environment variable$APPLIANCE_PG_MOUNT_POINT. -
Enter 2 to continue without partitioning the disk. A second prompt will confirm this choice. Selecting this option results in using the root filesystem for the data directory (not advised in most cases).
-
-
Enter Y or N for Should this appliance run as a standalone database server?
-
Select Y to configure the appliance as a database-only appliance. As a result, the appliance is configured as a basic PostgreSQL server, without a user interface.
-
Select N to configure the appliance with the full administrative user interface.
-
-
When prompted, enter a unique number to create a new region.
Creating a new region destroys any existing data on the chosen database. -
Create and confirm a password for the database.
ManageIQ then configures the internal database. This takes a few minutes. After the database is created and initialized, you can log in to ManageIQ.
Configuring an External Database
Based on your setup, you need to configure the appliance to use an external PostgreSQL database. For example, you can only have one database in a single region. However, a region can be segmented into multiple zones, such as database zone, user interface zone, and reporting zone, where each zone provides a specific function. The appliances in these zones must be configured to use an external database.
The postgresql.conf file requires
specific settings for correct operation. For example, it must correctly
reclaim table space, control session timeouts, and format the PostgreSQL
server log for improved system support. It is recommended that external databases use a
postgresql.conf file based on the standard file used by the
ManageIQ appliance.
Ensure you configure the settings in the postgresql.conf to suit your
system. For example, customize the shared_buffers setting according to
the amount of real storage available in the external system hosting the
PostgreSQL instance. In addition, depending on the aggregate number of
appliances that are expected to connect to the PostgreSQL instance, it might be
necessary to alter the max_connections setting.
Note:
- ManageIQ requires PostgreSQL version 13.

- `postgresql.conf` controls the operation of all databases managed by the PostgreSQL instance, therefore it is not recommended to run other databases on this PostgreSQL instance.
Use the following steps to configure an external PostgreSQL database:
-
Start the appliance and open a terminal console.
-
Enter the
appliance_consolecommand. The appliance console summary screen is displayed. -
Press Enter to manually configure settings.
-
Select Configure Application from the menu.
-
Choose Create Region in External Database for the database location.
-
Enter the database hostname or IP address when prompted.
-
Enter the database name or leave blank for the default (
vmdb_production). -
Enter the database username or leave blank for the default (
root). -
Enter the chosen database user’s password.
-
Confirm the configuration if prompted.
ManageIQ configures an external database.
Configuring General ManageIQ Settings
After configuring the general settings for the appliance and creating a database for it, you can now launch ManageIQ. To do this, use the Start EVM Server Processes option from the appliance console (Configuring General Appliance Settings). Once you launch ManageIQ, note the Hostname and IP Address displayed on the appliance console screen.
Open the ManageIQ web-based user interface by accessing either Hostname and IP Address on a web browser. At the login screen, use the following credentials:
-
Username: admin
-
Password: smartvm
Note:
You can also change the password of the admin account from the login screen. To do so, click the Update Password link.
You can access and configure most ManageIQ settings through the Configuration menu. You can access this menu through Administrator | EVM > Configuration.
The options under the  Configuration menu allow you to configure global options for your
ManageIQ environment, view diagnostic information, and view
analytics on the servers in the environment. The menu displays the
ManageIQ environment at the enterprise, zone, and server levels.
Configuration menu allow you to configure global options for your
ManageIQ environment, view diagnostic information, and view
analytics on the servers in the environment. The menu displays the
ManageIQ environment at the enterprise, zone, and server levels.
There are four main areas:
-
Settings
This menu allows you to configure global settings for your ManageIQ infrastructure. You can also create analysis profiles and schedules for these profiles.
-
Access Control
This menu contains options for configuring users, groups, roles, and tenants.
-
Diagnostics
This menu displays the status of your servers and their roles and provides access to logs.
-
Database
specify the location of your Virtual Machine Database (VMDB) and its login credentials.
Configuring ManageIQ Metrics for SmartState Analysis
You can also configure ManageIQ to perform a SmartState Analysis. This type of analysis collects details such as accounts, drivers, network information, hardware, and security patches on assets managed by the OpenStack provider. Enabling SmartState Analysis involves two steps:
These steps are required to allow ManageIQ to collect metrics from OpenStack and use them to perform a SmartState analysis. You can choose different servers to perform either function; the following sections assume that you will.
Configuring ManageIQ Capacity and Utilization
For metrics collection to work properly, you also need to configure ManageIQ to allow for all three Capacity & Utilization server roles, which are available from the settings menu under Configuration > Server > Server Control.
To enable these server roles:
-
Click Configuration, then select the server to configure from menu: Settings > Zone in the accordion menu on the left.
-
Browse to the Server Roles list in the menu: Server > Server Control section. From there, set the required capacity and utilization roles to ON, namely:
-
Capacity & Utilization Coordinator
-
Capacity & Utilization Data Collector
-
Capacity & Utilization Data Processor
-
-
Click Save.
Data collection is enabled immediately. However, the first collection begins 5 minutes after the server is started, and every 10 minutes after that. Therefore, the longest the collection takes after enabling the Capacity & Utilization Collector role is 10 minutes. The first collection from a particular provider may take a few minutes since ManageIQ is gathering data points going one month back in time.
For more information, see Capacity and Utilization Collection from the Deployment Planning Guide.
Enabling SmartState Analysis
After enabling the required server roles, enable SmartState analysis. See Smart State Analysis Support from the Support Matrix.
Enabling SmartState analysis is similar to Assigning the Capacity and Utilization Server Roles, in that the procedure also involves enabling server roles on a specific server. To do so:
-
Click Configuration.
-
Select the server to configure from menu: Settings[Zone] in the left pane of the appliance.
-
Browse to the Server Roles list in the menu: Server > Server Control section. From there, set the appropriate SmartState roles to ON. Namely:
-
SmartProxy
-
SmartState Analysis
-
-
Click Save.
Adding an OpenStack Infrastructure Provider
After initial installation and creation of a ManageIQ
environment, add an OpenStack infrastructure provider to the appliance.
ManageIQ supports operating with the OpenStack admin tenant.
When creating an OpenStack infrastructure provider in ManageIQ,
select the OpenStack infrastructure provider’s admin user because it
is the default administrator of the OpenStack admin tenant. When using
the admin credentials, a user in ManageIQ provisions into the
admin tenant, and sees images, networks, and instances that are
associated with the admin tenant.
Note:
-
You can set whether ManageIQ should use the Telemetry service or Advanced Message Queueing Protocol (AMQP) for event monitoring. If you choose Telemetry, you should first configure the ceilometer service on the undercloud to store events. See Configuring the Undercloud to Store Events for instructions. For more information, see OpenStack Telemetry (ceilometer) in the Red Hat OpenStack Platform Architecture Guide.
-
To authenticate the provider using a self-signed Certificate Authority (CA), configure the ManageIQ appliance to trust the certificate using the steps in Using a Self-Signed CA Certificate before adding the provider.
-
Browse to menu: Compute > Infrastructure > Providers.
-
Click Configuration, then click
 (Add
a New Infrastructure Provider).
(Add
a New Infrastructure Provider). -
Enter the Name of the provider to add. The Name is how the device is labeled in the console.
-
Select OpenStack Platform Director from the Type list.
-
Select the API Version of your OpenStack provider’s Keystone service from the list. The default is
Keystone v2.Note:
- With Keystone API v3, domains are used to determine administrative boundaries of service entities in OpenStack. Domains allow you to group users together for various purposes, such as setting domain-specific configuration or security options. For more information, see OpenStack Identity (keystone) in the Red Hat OpenStack Platform Architecture Guide.
- The provider you are creating will be able to see projects for the given domain only. To see projects for other domains, add it as another cloud provider. For more information on domain management in OpenStack, see Domain Management in the Red Hat OpenStack Platform Users and Identity Management Guide.
-
Select the appropriate Zone for the provider. By default, the zone is set to default.
Note:
For more information, see the definition of host aggregates and availability zones in OpenStack Compute (nova) in the Red Hat OpenStack Platform Architecture Guide.
-
In the Default tab, under Endpoints, configure the host and authentication details of your OpenStack provider:
-
Select a Security Protocol method to specify how to authenticate the provider:
-
SSL without validation: Authenticate the provider insecurely using SSL.
-
SSL: Authenticate the provider securely using a trusted Certificate Authority. Select this option if the provider has a valid SSL certificate and it is signed by a trusted Certificate Authority. No further configuration is required for this option. This is the recommended authentication method.
-
Non-SSL: Connect to the provider insecurely using only HTTP protocol, without SSL.
-
-
Enter the Host Name or IP address(IPv4 or IPv6) of the provider. If your provider is an undercloud, use its hostname (see Setting the Hostname for the System in Red Hat OpenStack Platform Director Installation and Usage for more details)
-
In API Port, set the public port used by the OpenStack Keystone service. By default, OpenStack uses port 5000 for non-SSL security protocol. For SSL, API port is 13000 by default.
-
In the Username field, enter the name of an OpenStack user with privileged access (for example, admin). Then, provide its corresponding password in the Password and Confirm Password fields.
-
Click Validate to confirm ManageIQ can connect to the OpenStack provider.
-
-
Next, configure how ManageIQ should receive events from the OpenStack provider. Click the Events tab in the Endpoints section to start.
-
To use the Telemetry service of the OpenStack provider, select Ceilometer. Before you do so, the provider must first be configured accordingly. See Configuring the Undercloud to Store Events for details.
-
If you prefer to use the AMQP Messaging bus instead, select AMQP. When you do: In Hostname (or IPv4 or IPv6 address) (of the Events tab, under Endpoints), enter the public IP or fully qualified domain name of the AMQP host.
-
In the API Port, set the public port used by AMQP. By default, OpenStack uses port 5672 for this.
-
In the Username field, enter the name of an OpenStack user with privileged access (for example, admin). Then, provide its corresponding password in the Password field.
-
Click Validate to confirm the credentials.
-
-
-
You can also configure SSH access to all hosts managed by the OpenStack infrastructure provider. To do so, click on the RSA key pair tab in the Endpoints section.
-
From there, enter the Username of an account with privileged access.
-
If you selected SSL in Endpoints > Default > Security Protocol earlier, use the Browse button to find and set a private key.
-
-
Click Add after configuring the infrastructure provider.
Note:
ManageIQ requires that the adminURL endpoint for all OpenStack services be on a non-private network. Accordingly, assign the adminURL endpoint an IP address of something other than 192.168.x.x. The adminURL endpoint must be accessible to the ManageIQ appliance that is responsible for collecting inventory and gathering metrics from the OpenStack environment. Additionally, all the Keystone endpoints must be accessible, otherwise refresh will fail.
Configuring the Undercloud to Store Events
To allow ManageIQ to receive events from a Red Hat OpenStack Platform environment, you must configure the notification_driver option for the Compute service and Orchestration service in that environment. See Installing the Undercloud and Configuring the Director in Red Hat OpenStack Platform Director Installation and Usage for related details.
Adding an OpenStack Cloud Provider
ManageIQ supports operating with the OpenStack admin tenant.
When creating an OpenStack provider in ManageIQ, select the
OpenStack provider’s admin user because it is the default
administrator of the OpenStack admin tenant. When using the admin
credentials, a user in ManageIQ provisions into the admin
tenant, and sees images, networks, and instances that are associated
with the admin tenant.
Note:
In OpenStack, you must add admin as a member of all tenants that users want to access and use in ManageIQ.
See Cloud Tenants in Managing Infrastructure and Inventory for information on working with OpenStack tenants (projects) in ManageIQ.
When adding an OpenStack cloud or infrastructure provider, enable tenant mapping in ManageIQ to map any existing tenants from that provider.
This means ManageIQ will create new cloud tenants to match each existing OpenStack tenant; each new cloud tenant and its corresponding OpenStack tenant will have identical resource assignments (including user and role synchronization) with the exception of quotas. Tenant quotas are not synchronized between ManageIQ and OpenStack, and are available for reporting purposes only. You can manage quotas in ManageIQ but this will not affect the quotas created in OpenStack.
During a provider refresh, ManageIQ will also check for any changes to the tenant list in OpenStack. ManageIQ will create new cloud tenants to match any new tenants, and delete any cloud tenants whose corresponding OpenStack tenants no longer exist. ManageIQ will also replicate any changes to OpenStack tenants to their corresponding cloud tenants.
If you leave tenant mapping disabled, ManageIQ will not create cloud tenants or tenant object hierarchy from OpenStack.
Note:
You can set whether ManageIQ should use the Telemetry service or Advanced Message Queueing Protocol (AMQP) for event monitoring. If you choose Telemetry, you should first configure the ceilometer service on the overcloud to store events. See Configuring the Overcloud to Store Events for instructions.
For more information, see OpenStack Telemetry (ceilometer) in the Red Hat OpenStack Platform Architecture Guide.
Note:
To authenticate the provider using a self-signed Certificate Authority (CA), configure the ManageIQ appliance to trust the certificate using the steps in Using a Self-Signed CA Certificate before adding the provider.
-
Browse to menu: Compute > Clouds > Providers.
-
Click Configuration, then click
(Add a New Cloud Provider). -
From the Type list, select OpenStack.
-
Enter a Name for the provider.
-
Select the appropriate Zone for the provider. By default, the zone is set to default.
Note:
For more information, see the definition of host aggregates and availability zones in OpenStack Compute (nova) in the Red Hat OpenStack Platform Architecture Guide.
-
Enter the OpenStack region in Provider Region.
-
(Optional) Select an associated Openstack Infra Provider
-
Select the appropriate API Version from the list. The default is
Keystone v2.If you select
Keystone v3, enter theKeystone V3 Domain IDthat ManageIQ should use. This is the domain of the user account you will be specifying later in the Default tab. If domains are not configured in the provider, enter default.Note:
Keystone API v3 is required to create cloud tenants on OpenStack cloud providers.
Note:
- With Keystone API v3, domains are used to determine administrative boundaries of service entities in OpenStack. Domains allow you to group users together for various purposes, such as setting domain-specific configuration or security options. For more information, see OpenStack Identity (keystone) in the Red Hat OpenStack Platform Architecture Guide.
- The provider you are creating will be able to see projects for the given domain only. To see projects for other domains, add it as another cloud provider. For more information on domain management in OpenStack, see Domain Management in the Red Hat OpenStack Platform Users and Identity Management Guide.
-
(Optional) Enable tenant mapping by toggling the Tenant Mapping Enabled option to Yes. This synchronizes resources and users between the OpenStack cloud provider and ManageIQ. By default, tenant mapping is disabled.
-
In the Default tab, under Endpoints, configure the host and authentication details of your OpenStack provider:
-
Select a Security Protocol method to specify how to authenticate the provider:
-
SSL without validation: Authenticate the provider insecurely using SSL.
-
SSL: Authenticate the provider securely using a trusted Certificate Authority. Select this option if the provider has a valid SSL certificate and it is signed by a trusted Certificate Authority. No further configuration is required for this option. This is the recommended authentication method.
-
Non-SSL: Connect to the provider insecurely using only HTTP protocol, without SSL.
-
-
In Hostname (or IPv4 or IPv6 address), enter the public IP or fully qualified domain name of the OpenStack Keystone service.
Note:
The hostname required here is also the OS_AUTH_URL value in the ~/overcloudrc file generated by the director (see Accessing the Overcloud in Red Hat OpenStack Platform Director Installation and Usage), or the ~/keystonerc_admin file generated by Packstack (see Evaluating OpenStack: Single-Node Deployment).
-
In API Port, set the public port used by the OpenStack Keystone service. By default, OpenStack uses port 5000 for non-SSL security protocol. For SSL, API port is 13000 by default.
-
In the Username field, enter the name of a user in the OpenStack environment.
In environments that use Keystone v3 authentication, the user must have the **admin** role for the relevant domain. -
In the Password field, enter the password for the user.
-
Click Validate to confirm ManageIQ can connect to the OpenStack provider.
-
-
Next, configure how ManageIQ should receive events from the OpenStack provider. Click the Events tab in the Endpoints section to start.
-
To use the Telemetry service of the OpenStack provider, select Ceilometer. Before you do so, the provider must first be configured accordingly. See Configuring the Overcloud to Store Events for details.
-
If you prefer to use the AMQP Messaging bus instead, or eventing is not enabled on Ceilometer, select AMQP and configure the following:
-
Select a Security Protocol method.
-
In Hostname (or IPv4 or IPv6 address) (of the Events tab, under Endpoints), enter the public IP or fully qualified domain name of the AMQP host.
-
In the API Port, set the public port used by AMQP. By default, OpenStack uses port 5672 for this.
-
In the Username field, enter the name of an OpenStack user with privileged access (for example, admin). Then, provide its corresponding password in the Password field.
-
Click Validate to confirm the credentials.
-
-
-
Click Add after configuring the cloud provider.
Note:
-
To collect inventory and metrics from an OpenStack environment, the ManageIQ appliance requires that the adminURL endpoint for the OpenStack environment be on a non-private network. Hence, the OpenStack adminURL endpoint should be assigned an IP address other than
192.168.x.x. Additionally, all the Keystone endpoints must be accessible, otherwise refresh will fail. -
Collecting capacity and utilization data from an OpenStack cloud provider requires selecting the Collect for All Clusters option under Configuration, in the settings menu. For information, see Capacity and Utilization Collections in the General Configuration Guide.
Configuring the Overcloud to Store Events
By default, the Telemetry service does not store events emitted by other services in a Red Hat OpenStack Platform environment. The following procedure outlines how to enable the Telemetry service on your OpenStack cloud provider to store such events. This ensures that events are exposed to ManageIQ when a Red Hat OpenStack Platform environment is added as a cloud provider.
-
Log in to the undercloud host.
-
Create an environment file called ceilometer.yaml, and add the following contents:
parameter_defaults: CeilometerStoreEvents: true -
Please see the below NOTE.
If your OpenStack cloud provider was not deployed through the undercloud, you can also set this manually. To do so:
-
Log in to your Controller node.
-
Edit /etc/ceilometer/ceilometer.conf, and specify the following option:
store_events = True
Note:
Passing the newly created environment file to the overcloud deployment is environment specific and requires executing commands in particular order depending on use of variables. For further information please see Director Installation and Usage in the Red Hat OpenStack Platform documentation.
Performing a SmartState Analysis
ManageIQ can analyze a cloud Instance or infrastructure host to collect metadata such as user accounts, applications, software patches, and other internal information. This key feature is called SmartState Analysis. SmartState analysis can be initiated manually or automatically using Control Policies.
To manually initiate SmartState analysis on an instance:
-
Browse to menu: Compute > Clouds > Instances.
-
Click on an instance in the All Instances by Provider nsection.
-
Click Configuration, and then
 (Perform SmartState Analysis). A
pop-up window will appear to confirm the action.
(Perform SmartState Analysis). A
pop-up window will appear to confirm the action. -
Click OK. The SmartState analysis will be initiated for the selected instance.
To manually initiate SmartState analysis on an Infrastructure host:
-
Browse to menu: Compute > Infrastructure > Providers.
-
Select a node in the Nodes section.
-
Click Configuration, and then
Perform SmartState Analysis. A
pop-up window will appear to confirm the action. -
Click OK. The SmartState analysis will be initiated for the selected node.
Using the Topology Widget
The Topology widget is an interactive topology graph, showing the status and relationships between the different resources and entities of the OpenStack providers that ManageIQ has access to.
- The topology graph includes instances, nodes, and other cloud resources within the overall OpenStack cloud provider environment.
- Each entity in the graph displays a color indication of its status.
-
Hovering over any individual graph element will display a summary of details for the individual element.
-
Double-click the entities in the graph to browse to their summary pages.
-
It is possible to drag elements to reposition the graph.
-
Click the legend at the top of the graph to show or hide entities.
- Click Display Names on the right-hand side of the page to show or hide entity names.
To view an OpenStack provider through the Topology widget:
-
Browse to menu: Compute > Cloud > Providers.
-
Click the desired OpenStack cloud provider for viewing the provider summary.
-
On the provider summary page, click Topology in the Overview box on the right-hand side of the page.
Managing Policies
Policies are used to manage your virtual environment. There are two types of policies available: compliance and control. Compliance policies are used to harden your virtual infrastructure, making sure that your security requirements are adhered to. Control policies are used to check for a specific condition and perform an action based on the outcome. For example:
-
Prevent virtual machines from running without an administrator account.
-
Prevent virtual machines from starting if certain patches are not applied.
-
Configure the behavior of a production virtual machine to only start if it is running on a production host.
-
Force a SmartState Analysis when a host is added or removed from a cluster.
ManageIQ policies are associated with cloud instances using virtual machine analysis profiles. These are the steps required to create a custom virtual machine analysis profile, and assigning it to a cloud instance for use with SmartState analysis, via a control policy.
Note:
For more detailed information about ManageIQ policies, see Assigning a Custom Analysis Profile to a Virtual Machine and Policies and Profiles Guide.
The following subsections demonstrate how to create host compliance and instance control policies.
Creating a Host Compliance Policy
The following procedure describes how to create a compliance policy that checks whether firewalls are enabled on infrastructure provider nodes. Nodes with disabled firewalls are marked non-compliant.
-
Navigate to Control > Explorer.
-
Expand the Policies accordion, and click Compliance Policies.
-
Select Host Compliance Policies.
-
Click
 (Configuration),
(Add a New Host/Node Compliance Policy).
(Configuration),
(Add a New Host/Node Compliance Policy). -
Type in a Description for the policy.
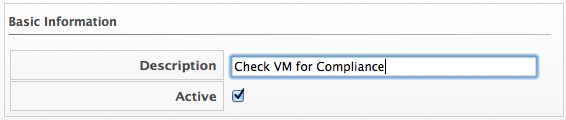
-
Uncheck Active if you do not want this policy processed even when assigned to a resource.
-
Add Host / Node.Firewall Rules : Active CONTAINS “true” to the scope of the policy . To do so:
-
In drop-down below the Scope section, choose Field. When you do, a new drop-down will appear below it; from there, select Host/Node.Firewall.Rules: Active.
-
A new drop-down will appear; from there, select true.
-
Click
 (Commit expression element changes) to add the scope.
-
-
In the Notes area, add a detailed explanation of the policy.
-
Click Add. The policy will be added and listed under Host Compliance Policies in the Policies accordion.
Next, create a policy profile and assign this new compliance policy to it:
-
Browse to menu: Control > Explorer.
-
Click on the Policy Profiles accordion, then click Configuration, then
(Add a New Policy Profile). -
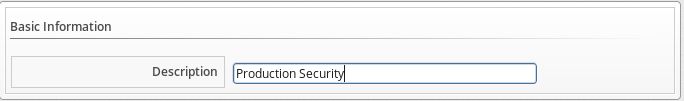
In the Basic Information area, type in a unique description for the policy profile.
-
From Available Policies in the Policy Selection area select all the policies you need to apply to this policy profile. Use the
Ctrlkey to select multiple policies.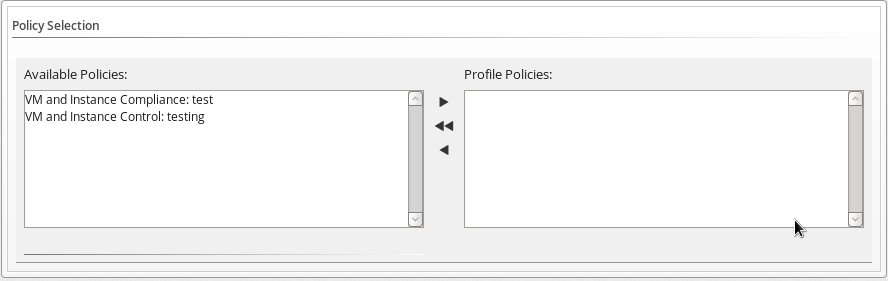
-
Click
 to add the Policies.
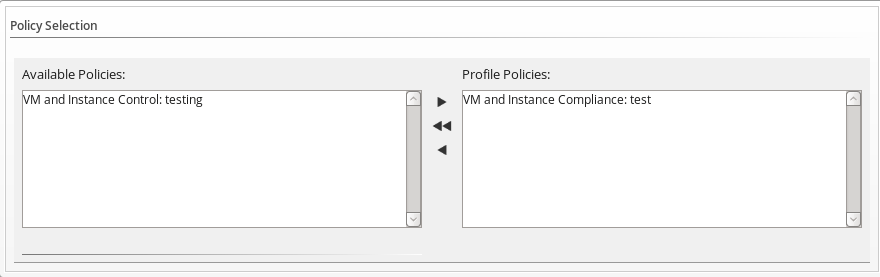
-
Add to the Notes area if required.
-
Click Add.
At this point, you can now add the new policy profile to the infrastructure provider hosts:
-
Browse to menu: Compute > Infrastructure > Providers, verify the provider you need to assign the policy profiles to.
-
Click
 (Policy), and then click
 (Manage Policies).
 -
From the Select Policy Profiles area, you can click on the triangle next to a desired policy profile to expand it and see its member policies.
-
Check the policy profiles you require to apply to the provider. It turns blue to show its assignment state has changed.
-
Click Save.
Creating a Virtual Machine Control Policy
The process of creating a control policy is similar to that of a compliance policy. A control policy is driven by events after certain conditions are met. The following control policy will start a SmartState analysis on an instance every 24 hours:
-
Navigate to Control > Explorer.
-
Expand the Policies accordion, and click Control Policies.
-
Select Vm Control Policies.
-
Click
(Configuration), then
(Add a New VM and Instance Control Policy). -
Enter a Description. This will be the name given to your VM control policy.
-
Uncheck Active if you do not want this policy processed even when assigned to a resource.
-
Add VM and Instance : Last Analysis Time IS “Yesterday” to the scope of the policy. To do so:
-
In drop-down below the Scope section, choose Field. When you do, a new drop-down will appear below it; from there, select VM and Instance : Last Analysis Time.
-
A new drop-down will appear; from there, select true.
-
Click
(Commit expression element changes) to add the scope.
-
-
Click Add. The policy is added and listed under Vm Control Policies in the Policies accordion.
You can now associate events, conditions, and actions to this control policy. To do so:
-
Navigate to Control > Explorer.
-
Click the Policies accordion, and select the control policy you just created.
-
Click
(Configuration),
(Edit this Policy’s Condition assignments). -
In the VM Operation section, select VM Power On.
-
Click Save. The VM Power On event should appear under your policy.
You can now associate an action to the VM Power On event. To do so:
-
Select the VM Power On event.
-
Click
(Configuration), then
(Edit Actions for this Policy Event). -
In the Order of Actions if ALL Conditions are True section, select Generate Log Message and Initiate SmartState Analysis for VM.
-
Click Save.
Next, create a policy profile and assign this new control policy to it:
-
Navigate to Control > Explorer.
-
Click on the Policy Profiles accordion, then click
(Configuration), then
(Add a New Policy Profile). -
Enter
Most Recent SmartStatein the Description field. -
In the Policy Selection area, choose the control policy you created earlier. This should have VM and Instance Control in its name. Add this policy to the Profile Policies box.
-
Click Add.
At this point, you should now be able to add the policy profile to the cloud providers.
-
Navigate to Compute > Cloud > Providers.
-
Select the overcloud you added in Configuring the Overcloud to Store Events.
-
Click
(Policy), then
(Manage Policies). -
Under Select Policy Profiles, select Most Recent SmartState.
-
Click Save.
Managing Instances
Cloud instance provisioning goes through three phases:
-
Request: This includes ownership information, tags, virtual hardware requirements, the operating system, and any customization required. See Provisioning Requests from the Provisioning Virtual Machines and Hosts guide for more details.
-
Approval: Provisioning requests are then approved or denied. This phase can happen automatically or manually. See Provisioning Request Approval Methods from the Provisioning Virtual Machines and Hosts guide for more details.
-
Provision: Approved provisioning requests are executed. See Working with Provisioning Requests from the Provisioning Virtual Machines and Hosts guide for more details.
Provisioning an OpenStack Instance from an Image
Create a request to provision Red Hat OpenStack Platform cloud instances from images, volumes, and volume snapshots using ManageIQ. Only bootable volumes not in use will be available.
-
Browse to menu: Compute > Clouds > Instances
-
Click
 (Lifecycle), then click
(Provision Instances).
(Lifecycle), then click
(Provision Instances). -
Select an OpenStack image, volume or volume snapshot from the list presented. These files must be available on your OpenStack provider.
-
Click Continue.
-
On the Request tab, enter information about this provisioning request. In Request Information, type in at least an email address. This email is used to send the requester status emails during the provisioning process for items such as auto-approval, quota, provision complete, retirement, request pending approval, and request denied. The other information is optional. If the ManageIQ Server is configured to use LDAP, you can use the Look Up button to populate the other fields based on the email address.
Note:
Parameters with a * next to the label are required to submit the provisioning request. To change the required parameters, see Customizing Provisioning Dialogs.
-
Click the Purpose tab to select the appropriate tags for the provisioned instance.
-
Click the Catalog tab for basic instance options.
-
To change the source file to use as a basis for the instance, select it from the list of images, volumes, or volume snapshots.
-
Select the Number of Instances to provision.
-
Type a Instance Name and Instance Description.
-
-
Click the Environment tab to select the instance’s Cloud Tenant, Availabilty Zones, Cloud Network, Security Groups, and Public IP Address. If no specific Cloud Tenant is required, select the Choose Automatically checkbox.
-
Click the Properties tab to set provider options such as flavors and security settings.
-
Select a flavor from the Instance Type list.
-
Select a Guest Access Key Pair for access to the instance. For more information about key pairs, see Managing Key Pairs.
-
-
Click the Volumes tab to provision any volumes with the instance. Volumes are useful for augmenting ephemeral storage of instances with persistent, general-purpose block storage:
-
Fill in the Volume Name and Size (gigabytes) fields.
-
If you want the volume to be deleted once the instance terminates (thereby making it non-persistent), check Delete on Instance Terminate.
-
To provision and add multiple volumes to the instance, click Add Volume. Doing so will add new fields you can fill in.
For more information about persistent storage in OpenStack, see the Red Hat OpenStack Platform Storage Guide.
-
-
Click the Customize tab to set additional instance options.
-
Under Credentials, enter a Root Password for the root user access to the instance.
-
Enter a IP Address Information for the instance. Leave as DHCP for automatic IP assignment from the provider.
-
Enter any DNS information for the instance if necessary.
-
Select a Customize Template for additional instance configuration. Select from the Cloud-Init scripts stored on your appliance.
-
-
Click the Schedule tab to set the provisioning and retirement date and time.
-
In Schedule Info, choose whether the provisioning begins upon approval, or at a specific time. If you select Schedule, you will be prompted to enter a date and time.
-
In Lifespan, select whether to power on the instances after they are created, and whether to set a retirement date. If you select a retirement period, you will be prompted for when to receive a retirement warning.
-
-
Click Submit.
The provisioning request is sent for approval. For the provisioning to begin, a user with the admin, approver, or super admin account role must approve the request. The admin and super admin roles can also edit, delete, and deny the requests. You will be able to see all provisioning requests where you are either the requester or the approver.
After submission, the appliance assigns each provision request a Request ID. If an error occurs during the approval or provisioning process, use this ID to locate the request in the appliance logs. The Request ID consists of the region associated with the request followed by the request number. As regions define a range of one trillion database IDs, this number can be several digits long.
Request ID Format
Request 99 in region 123 results in Request ID 123000000000099.
Managing Storage
Two types of storage managers are currently available to
ManageIQ: OpenStack Block Storage (openstack-cinder) and
OpenStack Object Storage (openstack-swift). OpenStack Block Storage
provisions and manages block storage, whereas OpenStack Object Storage
manages object storage within the cloud. These storage managers are
discovered automatically by ManageIQ after adding an OpenStack
cloud provider.
For more information, see Storage Managers from the Managing Providers guide.
Managing Block Storage
The OpenStack Block Storage service (openstack-cinder) provides and manages persistent block storage resources that OpenStack infrastructure instances can consume. ManageIQ provides an interface for
managing these resources (volumes, volume backups, and volume snapshots).
To create a volume:
-
Browse to menu: Storage > Block Storage > Volumes.
-
Click Configuration, then click
(Add a new Cloud Volume). -
Select the OpenStack Block Storage manager from the Storage Manager list.
-
Enter a Volume Name.
-
Enter the size of the volume in gigabytes (GB).
-
Under Placement, select the cloud tenant to attach it to.
-
Click Add.
The volume appears in the list of volumes after it has been provisioned.
To attach a volume to an instance (for example, one created through Provisioning an OpenStack Instance from an Image):
-
Browse to menu: Storage > Block Storage > Volumes.
-
Select the volume to attach.
-
Click Configuration, then click
 (Attach selected Cloud Volume
to an Instance) to open the Attach Cloud Volume screen.
(Attach selected Cloud Volume
to an Instance) to open the Attach Cloud Volume screen. -
Select an instance from the list.
-
Optionally, enter a Device Mountpoint.
-
Click Attach.
To view a timeline of storage manager events:
-
Browse to menu: Storage > Storage Managers.
-
Select your OpenStack Cinder manager to go to the Cinder manager’s summary page.
-
Click
 (Monitoring), and then
 (Timelines) to view the events
timeline for the manager.
(Timelines) to view the events
timeline for the manager. -
A timeline of either management events or policy events can be viewed.
-
To view management events, select Management Events.
-
Specify the type of event to view.
-
Specify the timeline for the events to view.
-
Click Apply.
-
-
To view policy events, select Policy Events.
-
Specify if you want to view successful events, failed events, or both.
-
Specify the timeline for the events to view.
-
Click Apply.
-
To back up a volume:
-
Browse to menu: Storage < Block Storage < Volumes.
-
Click the volume you want to back up to open the volume’s summary page.
-
Click Configuration, then click
(Create a Backup of this Cloud
Volume). -
Enter a name for the backup in Backup Name.
-
(Optional) Select Incremental? to take an incremental backup of the volume instead of a full backup.
Note:
You can take an incremental backup of a volume if you have at least one existing full backup of the volume. An incremental volume saves resources by capturing only changes made to the volume since its last backup. See Create an Incremental Volume Backup in the Storage Guide for more information.
-
(Optional) Select Force? to allow backup of a volume attached to an instance.
Note:
Selecting the Force option will back up the volume whether its status is available or in-use. Backing up an in-use volume ensures data is crash-consistent.
-
Click Save.
View a volume’s backups by clicking Cloud Volume Backups on the volume’s summary page.
Note:
See Back Up and Restore a Volume in the Storage Guide for more information about backups.
To take a volume snapshot:
-
Browse to menu: Storage > Block Storage > Volumes.
-
Click the volume to snapshot to open the volume’s summary page.
-
Click Configuration, then click
(Create a Snapshot of this Cloud
Volume). -
Enter a name for the snapshot in Snapshot Name.
-
Click Save.
Click Cloud Volume Snapshots on the summary page of a volume to view the snapshots for that volume.
Note:
See Create, Use, or Delete Volume Snapshots in the Storage Guide for more information about snapshots.
For more information about available options for block storage resources in ManageIQ, see OpenStack Block Storage Managers in the Managing Providers guide.
Managing Object Storage
The OpenStack Object Storage (openstack-swift) service provides cloud object storage. The object store summary page shows details including the object store’s size, parent cloud, storage manager, cloud tenant,
and the number of cloud objects on the object store.
To view the summary page of an object store:
-
Browse to menu: Storage > Object Stores to display a list of object store containers.
-
Click a container to open a summary page for that object store container.
-
Click Cloud Objects to view a list of object stores in the object store container.
-
Click an object store from the list to view the object store’s summary page.
Catalogs and Services
In Provisioning an OpenStack Instance from an Image, Volume or Volume Snapshot, you provisioned instance manually by entering values in provisioning dialogs such as name, size, image, CPUs, etc. Catalogs are used to create groups of instances for provisioning. ManageIQ enables users to provision instances via a single Order button.
Creating a service catalog involves:
-
Creating a Service Dialog. This is a UI interface element that allows users to interact with the service (for example, a drop-down list).
-
Creating a Catalog Item for each instance that will be part of the service.
-
Creating a method for the Service Dialog. This method defines what each option means to each individual cloud instances for the service. This method is called from a service provisioning instance in the Automate model.
Note:
For more information about catalogs and services, see Catalogs and Services from the Provisioning Virtual Machines and Hosts guide.
Creating a Service Dialog
When provisioning a service, input will be needed from the requester. Service Dialogs are used to take input from the user. This input is connected to a method in the Automate model that defines how user input is translated into the provision request. Before creating a Service Dialog, be sure to plan what items you need the user to input.
-
Browse to menu: Automation > Automate > Customization.
-
Click the Service Dialogs accordion.
-
Click Configuration, and then
(Add a new Dialog). -
In Dialog Information, enter a Label and Description. Check the boxes for the buttons you want available at the bottom of the dialog form. The description will appear as hover text.
As you enter the Label of the dialog, it should appear in the Dialog pane on the left.
-
Click
(Add), then
(Add a New Tab to this Dialog). -
Enter a Label and Description for this tab.
As you enter the Label of the tab, it should appear in the Dialog pane on the left under the dialog you are creating.
-
Click
(Add), then
(Add a New Box to this Tab). -
Enter a Label and Description for this box.
As you enter the Label of the box, it should appear in the Dialog pane on the left under the tab you are creating.
-
-
Add an element to this box. Elements are controls that accept input.
-
Click
(Add), then
(Add a New Element to this Box). -
Enter a Label, Name, and Description for this element.
**Name** must use only alphanumeric characters and underscores without spaces. It is also used to retrieve the value of this element in the method used with the dialog and must start with **dialog\_service\_type** -
Select a Type for an element type. All Type options have a Required and Default Value field. Check Required or set Required to true if the element is required to proceed. You can also specify a default value. The rest of the options presented are based on which type of element you select.
Element Types Additional Info Check Box Check Default Value if you want this check box checked by default. Date Control Use Date Control to create a field where users can select a date. If you want users to be able to select a date and time, use the Date/Time Control option. Date/Time Control Use Date/Time Control to create a field where users can select a date and time. Only one Date Control or Date/Time Control element can be present in a dialog. Drop Down Dynamic List Use Drop Down Dynamic List if you want the list options to be created using automate methods. Use Entry Point (NS/Cls/Inst) to select an automate instance. Check Show Refresh Button to allow users to refresh the list options manually. Radio Button This element type serves the same purpose as Drop Down List but displays options using radio buttons. Tag Control Select a Category of tags you want assigned to the virtual machines associated with this service dialog. Check Single Select if only one tag can be selected. Text Area Box Provides text area for users to enter some text. You can also leave a message to users by typing in the Default Value field or leave it as blank. Text Box This element type serves the same purpose as Text Area Box with the option to check Protected so the text is shown as asterisks (*), instead of plain text.
-
-
Continue adding the dialog items you need. You can switch between dialogs, tabs, boxes, and elements by selecting their respective labels from the Dialog pane on the left.
-
Click Add. Your dialog should appear in the Service Dialogs accordion.
Creating a Catalog
A catalog is a way to organize or categorize catalog items and bundles. Before you can associate a catalog item into a catalog, create an empty catalog first:
-
Navigate to Services > Catalogs.
-
Click the Catalogs accordion.
-
Click
(Configuration), and then
(Add a New Catalog). -
Enter a Name and Description, leaving everything else blank.
-
Click Add.
Creating a Catalog Item
-
Navigate to Services > Catalogs.
-
Click the Catalog Items accordion.
-
Click
(Configuration), and then
(Add a New Catalog Item). -
Select OpenStack from the Catalog Item Type drop-down.
-
In the Basic Info subtab:
-
Type a Name/Description.
-
Check Display in Catalog to edit Catalog, Dialog, and Entry Point(NS/Cls/Inst) options.
-
Provisioning Entry Point (Domain/NS/Cls/Inst) requires you to select an Automate instance to run upon provisioning. Navigate to ManageIQ/Service/Provisioning/State‐Machines/ServiceProvision_Template/CatalogItemInitialization and click Apply.
-
Retirement Entry Point (Domain/NS/Cls/Inst) requires you to select an Automate instance to run upon retirement. Navigate to ManageIQ/Service/Provisioning/State‐Machines/ServiceProvision_Template/CatalogItemTermination and click Apply.
Note:
The entry point must be a State Machine since the Provisioning Entry Point list is filtered to only show State Machine class instances. No other entry points will be available from the Provisioning Entry Point field.
You can only choose from the catalogs and dialogs you have already created. If you haven’t done so, leave the values blank and edit later.
-
-
-
In the Details subtab, write a Long Description for the catalog item.
-
In the Request Info subtab, select provisioning options that apply to the provider chosen.
-
Click Add.
Ordering a Catalog Item
-
Browse to menu: Services > Catalogs.
-
Click the Service Catalogs accordion, and select the service to provision.
-
Click Order.
-
On the Order Service screen, select the box for Do you want to continue? and click Submit.
Reports
ManageIQ provides a large group of default reports organized into categories. Each category has its own set of subfolders. These reports have been constructed to help you view the most commonly requested and significant data.
The categories of predefined reports available on ManageIQ are:
-
Configuration Management: hardware, application, network, service, user account, operating system, and snapshot information for all of your items.
-
Migration Readiness: information related to items required to migrate a virtual machine.
-
Operations: free space on registered and unregistered virtual machines, power states for virtual machines, and SmartState analysis status.
This category also provides reports relating to the operation of ManageIQ, such as user IDs and snapshots taken by ManageIQ.
-
VM Sprawl: usage information and disk waste.
-
Relationships: virtual machine, folder, and cluster relationships.
-
Events: operations and configuration management events.
-
Performance by Asset Type: performance of your virtual infrastructure.
You must be capturing capacity and utilization data to get this information.
-
Running Processes: information on processes running on a virtual machine.
You must have domain credentials entered for the zone to collect the information for these reports, and the virtual machine must have been analyzed at least once.
-
Trending: projections of datastore capacity, along with host CPU and memory use.
-
Tenants: quotas report aggregated by each tenant that shows quota name, total quota, in use, allocated, and available. The report currently lists all tenants and there is no nesting information available by parent and child tenants.
-
Provisioning: provisioning activity based on the approver, datastore, requester, and virtual machine.
For more detailed information on managing reports, see Monitoring, Alerts, and Reporting.
Generating a Single Report
-
Browse to menu: Overview > Reports
-
Click the Reports accordion and select the report you want to view.
-
Click
(Queue). -
The report generation is placed on the queue and its status shows in the reports page.

-
Click
 (Reload current display) to
update the status.
(Reload current display) to
update the status. -
When a report has finished generating, click on its row to view it.
Scheduling a Report
You can view historical data by creating reports on a scheduled basis. In addition, scheduled reports can be emailed directly to users:
-
Navigate to Overview > Reports
-
Click the Reports accordion and select the report you want to view.
-
Click
(Configuration), then Add a
new Schedule. -
Fill in the Basic Information section.
-
Configure the Report Selection.
-
Configure the report’s schedule and frequency in the Timer section.
-
Click Save.
Viewing Reports
Once you have created a schedule for a report, you can view it at any time after the first scheduled time has occurred.
-
Navigate to Overview > Reports.
-
Click the Saved Reports accordion or the Reports accordion.
-
Click on the instance of the report you want to view.
Chargeback
The chargeback feature allows you to calculate monetary virtual machine charges based on owner or company tag. To use this feature you must be collecting capacity and utilization data. For information on server control settings and capacity & utilization collection settings, see Capacity and Utilization Collection Settings.
Creating Chargeback Rates
ManageIQ allows you to create your own set of computing and storage costs to use for billing.
Chargeback rates can be configured at a single rate or in tiers, where one rate is assigned to one usage range, and another rate is assigned to a different usage range. You can also assign fixed and variable rates per tier if desired.
-
Navigate to Overview > Chargeback.
-
Click the Rates accordion and select Compute to create a CPU chargeback rate.
-
Click
(Configuration) and
(Add a new Chargeback Rate). -
Type in a Description for the chargeback rate.
-
Select Currency and fill in the Rate Details.
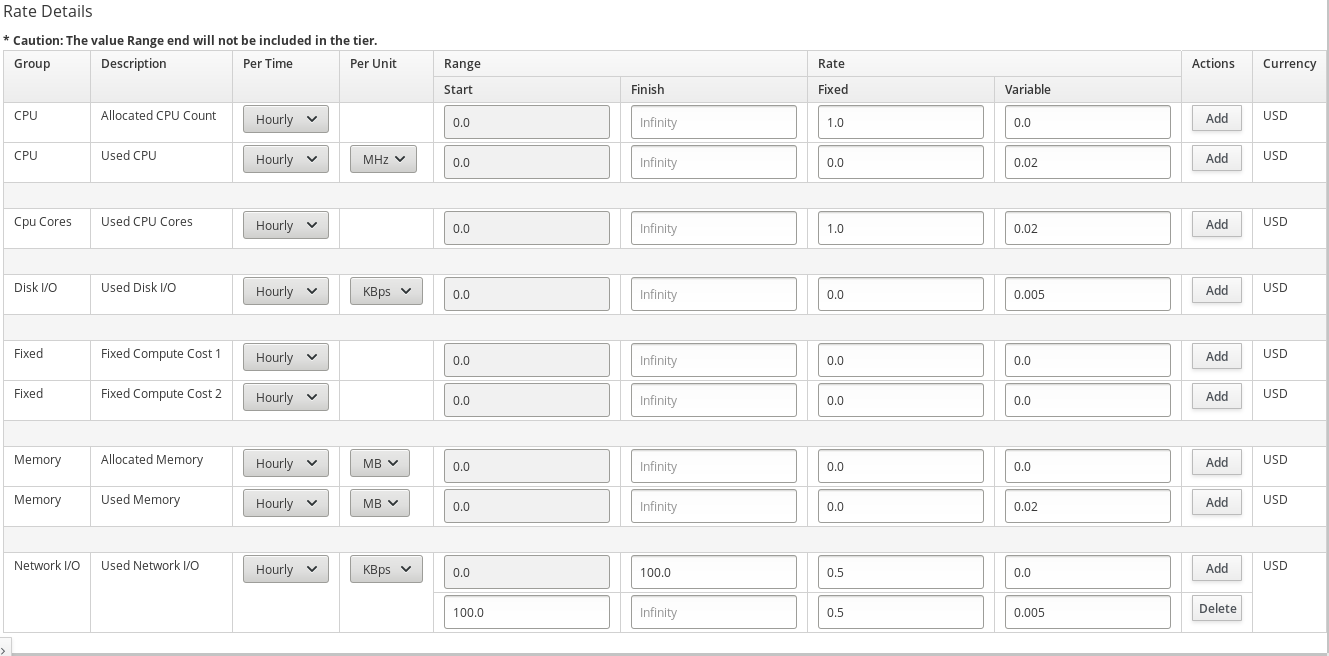
-
Click Add.
Assigning Chargeback Rates
After assigning a chargeback rate, assign it to a cloud provider.
-
Navigate to Overview > Chargeback.
-
Click the Assignments accordion, and click either Compute or Storage.
-
In the Basic Info area, select Selected Cloud/Infrastrcture Providers.
-
Select the chargeback rate you created in Creating Chargeback Rates.
-
Click Save.
Creating a Chargeback Report
ManageIQ allows you to create chargeback reports to monitor costs you charged.
-
Browse to menu: Overview > Reports.
-
Click the Reports accordion.
-
Click Configuration, then click
Add a new Report. -
On the Columns tab, fill out the Basic Report Info area.
-
Type a unique name in Menu Name for how you want the report described in the menu list.
-
Type the Title to display on the report.
-
-
Add fields in the Configure Report Columns area.
-
From the Base the report on list, select Chargebacks.
-
Select the fields to include in the report from the Available Fields list, then click
 Move selected fields down. In addition to the fields, you can also select any tags that you have created and assigned.
 -
Change the order of the fields in the report by clicking
 Move selected fields up or
Move selected fields down.
Move selected fields up or
Move selected fields down.
-
-
Click the Formatting tab to set the size of paper for a PDF and column header format.
-
From the PDF Output area, select the page size from the Page Size list.
-
From Specify Column Headers and Formats, type the text to display for each field. For each numeric field, you can also set the numeric format.
-
-
Click the Filter tab to set filters for the data displayed in the report.
-
From Chargeback Filters, select how you want the costs to show, the tag category, the tag, and how you want the items grouped.
-
From Chargeback Interval, select the time interval. You must have a full interval worth of data in order to select an option other than Partial in the Daily Ending With list.
-
-
Click the Preview tab, and then Load to see what the report will look like.
-
When you are satisfied that you have the report that you want, click Add to create the new report.
The new report is created. To make the report accessible from the Report menu, you must add it to a report menu.
Using a Self-Signed CA Certificate
Adding a self-signed Certificate Authority (CA) certificate for SSL authentication requires more configuration on OpenStack Platform and Microsoft System Center Virtual Machine Manager (SCVMM) providers.
Note: This procedure is not required for OpenShift Container Platform, or Red Hat Virtualization, which have the option to select SSL trusting custom CA as a Security Protocol in the user interface. These steps are needed only for providers without this option in the user interface.
Before adding the provider, configure the following:
-
Copy your provider’s CA certificate in PEM format to
/etc/pki/ca-trust/source/anchors/on your ManageIQ appliance. -
Update the trust settings on the appliance:
# update-ca-trust -
Restart the EVM processes on the server:
# rake evm:restart
The CA certificate is added to the appliance, and you can add the provider to ManageIQ.
Customizing Provisioning Dialogs
The default set of provisioning dialogs shows all possible options. However, ManageIQ also provides the ability to customize which tabs and fields are shown. You can decide what fields are required to submit the provisioning request or set default values.
For each type of provisioning, there is a dialog that can be created to adjust what options are presented. While samples are provided containing all possible fields for provisioning, you can remove what fields are shown but cannot add new fields or tabs.
Edit the dialogs to:
-
Hide or show provisioning tabs.
-
Hide or show fields. If you hide an attribute, the default will be used, unless you specify otherwise.
-
Set default values for a field.
-
Specify if a field is required to submit the request.
-
Create custom dialogs for specific users.
Creating Custom Buttons for Cloud Tenants
ManageIQ also allows you to create custom buttons for cloud tenants. This is useful for providing shortcuts to functionalities and features frequently used by specific tenants.
Note:
This capability is made possible through the Automate model. See Understanding the Automate Model from the Scripting Actions in ManageIQ guide for more details.
The following subsections summarize the two main steps for creating a custom button for cloud tenants.
Creating a Custom Button Group
A button group is a label for a collection of buttons under an object type. To create a button group:
-
Browse to menu: Automation > Automate > Customization.
-
Click the Buttons accordion.
-
From the Object Types tree, select the type of object you want to create the button group for.
-
Click
Configuration, Add a new Button Group. -
Type in a Button Group Text and Button Group Hover Text, and select the Button Group Image that you want to use.
-
If custom buttons have already been created, assign them to the button group. If not, see Creating a Custom Button.
-
Click Add.
The button group will show in the Cloud Tenant object type. When it does, create a custom button for any tenant within the OpenStack Cloud (see Creating a Custom Button).
Creating a Custom Button
-
Browse to menu: Automation > Automate > Customization.
-
Click the Buttons accordion.
-
From the Object Types tree, select the type of object you want to create the button for.
-
Click Unassigned Buttons.
-
Click Configuration, then
Add a new Button.Note:
If
Add a new Button is not available, that means you have not created a button group for that object. To continue, create a button group first. See Creating a Custom Button. -
Under the Options tab:
-
Select the Button type from the list.
-
Enter button Text and Hover Text, and select the Icon and Icon Color to use.
-
Select a Dialog if applicable.
-
Check Open URL to open a browser window for the custom URL returned when the button is executed.
-
Choose a Display For option for the button.
-
Select a Submit parameter to choose how to submit objects to automate. Selecting Submit All will pass all objects at once when the button is executed, while choosing One by one will run execute the button action each time per object.
-
-
Under the Advanced tab:
-
Set button Enablement. Click Define Expression to access the expression editor tool. Enter Disabled Button Text to display when the custom button is disabled.
-
Use Visibility to determine button appearance based on a custom expression. Click Define Expression to access the expression editor tool.
Note:
For more about setting visibility and enablement for a custom button, see Filtering.
-
In Object Details, select Request from the
/System/Process/dropdown. By default, the message iscreate. Do not change it. -
Enter a Request name for the
/System/Process/Requestinstance. -
Enter the Attribute/Value Pairs fields if applicable.
-
Set Role Access. Selecting <By Role> will display available roles. Check applicable roles.
-
-
Click Add when you have confirmed that the button accomplishes the task you want.
The button will show in the object type you added the button to. See Invoking Automate from the Scripting Actions in guide for more in-depth coverage.
Managing Keypairs
Key pairs allow you to manage SSH access between a user and provisioned instance. For more information about key pairs in OpenStack, see Manage Key Pairs in the Instances and Images Guide.
To manage key pairs, browse to menu: Compute > Clouds > Key Pairs. From there, you can view a list of available key pairs. Click on a key pair to view its details.
To create a new key pair:
-
Browse to menu: Compute > Clouds > Key Pairs.
-
Click Configuration,
 (Add a new Key Pair).
 -
Enter a Name for the key pair.
-
If you want to use a public key, copy its contents into the Public Key (optional) field.
Note: You must have a public key value for the IBM POWER VS provider to create the key pair. An error message is returned if you fail to add a public key value and can be viewed in Settings > Tasks.
-
Select which cloud provider on which to create the key pair. The key pair will then be available for use by instances in that provider.
-
Click Add.