- Deployment Planning Guide
- Introduction to ManageIQ
- Capacity Planning
- Capacity and Utilization Collection
- Assigning the Capacity and Utilization Server Roles
- Adding Database Credentials for Data Collection
- Data Collection for Red Hat Virtualization
- Data Collection for Red Hat Enterprise Linux OpenStack Platform
- Capacity and Utilization Data Collected
- Capacity and Utilization Chart Features
- Planning Where to Put a New Virtual Machine
- Appendix
Deployment Planning Guide
Introduction to ManageIQ
ManageIQ delivers the insight, control, and automation that enterprises need to address the challenges of managing virtual environments. This technology enables enterprises with existing virtual infrastructures to improve visibility and control, and those starting virtualization deployments to build and operate a well-managed virtual infrastructure.
ManageIQ provides the following feature sets:
-
Insight: Discovery, Monitoring, Utilization, Performance, Reporting, Analytic, Chargeback, and Trending.
-
Control: Security, Compliance, Alerting, and Policy-Based Resource, and Configuration Enforcement.
-
Automate: IT Process, Task and Event, Provisioning, and Workload Management and Orchestration.
-
Integrate: Systems Management, Tools and Processes, Event Consoles, Configuration Management Database (CMDB), Role-based Administration (RBA), and Web Services.
Architecture
The diagram below describes the capabilities of ManageIQ. Its
features are designed to work together to provide robust management and
maintenance of your virtual infrastructure. 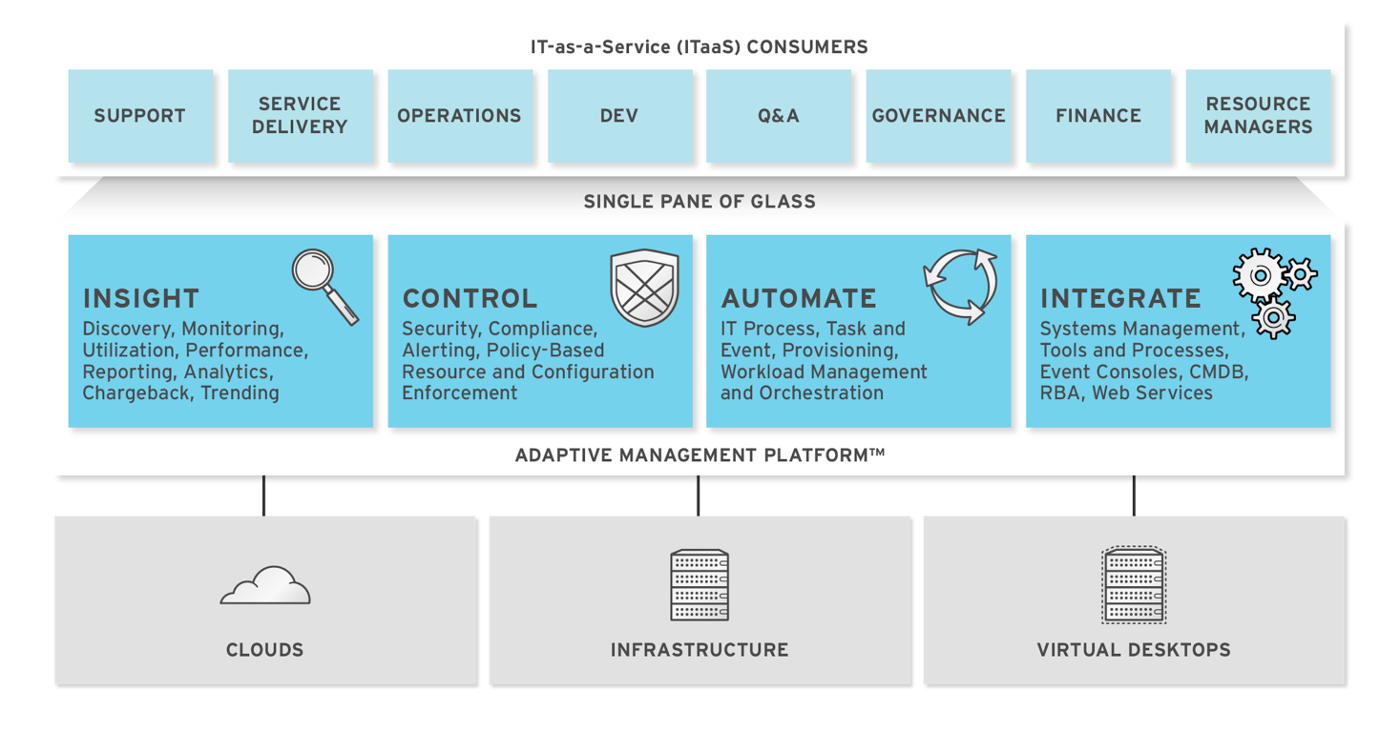
The architecture comprises the following components:
-
The ManageIQ appliance (appliance) which is supplied as a secure, high-performance, preconfigured virtual machine. It provides support for HTTPS communications.
-
The ManageIQ Server (Server) resides on the appliance. It is the software layer that communicates between the SmartProxy and the Virtual Management Database. It includes support for HTTPS communications.
-
The Virtual Management Database (VMDB) resides either on the appliance or another computer accessible to the appliance. It is the definitive source of intelligence collected about your Virtual Infrastructure. It also holds status information regarding appliance tasks.
-
The ManageIQ Console (Console) is the Web interface used to view and control the Server and appliance. It is consumed through Web 2.0 mash-ups and web services (WS Management) interfaces.
-
The SmartProxy can reside on the appliance or on an ESX Server. If not embedded in the Server, the SmartProxy can be deployed from the appliance. A SmartProxy agent must configured in each storage location, and must be visible to the appliance. The SmartProxy acts on behalf of the appliance communicating with it over HTTPS on standard port 443.
Requirements
To use ManageIQ, certain virtual hardware, database, and browser requirements must be met in your environment.
Virtual Hardware Requirements
The ManageIQ appliance requires the following virtual hardware at minimum:
-
4 VCPUs
-
12 GB RAM
-
44 GB HDD + optional database disk + optional messaging disk
Database Requirements
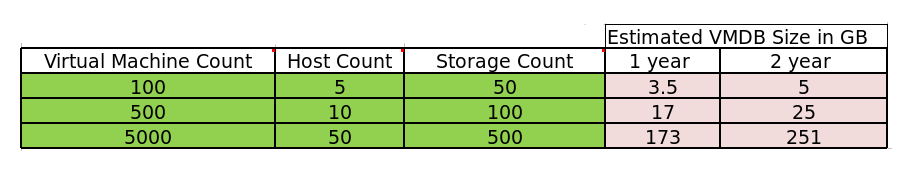
Red Hat recommends allocating the virtual machine disk fully at the time of creation. Three main factors affect the size of your database over time:
-
Virtual Machine Count: the most important factor in the calculation of virtual machine database (VMDB) size over time.
-
Host Count: the number of hosts associated with the provider.
-
Storage Count: the number of individual storage elements as seen from the perspective of the provider or host. It is not the total number of virtual disks for all virtual machines.
Use the following table as a guideline to calculate minimum requirements for your database:
Note:
When enabling capacity and utilization for metrics gathering over a period of time, it is recommended that the VMDB size scale accordingly. Evaluate the number of instances in your provider inventory and storage duration requirements to plan for increased VMDB sizing requirements.
Use the following information to plan for your increased VMDB needs when working with metrics gathering:
-
Realtime metrics data are stored for 4 hours.
-
Rollup metrics data are stored for 6 months.
Example:
| Minute | Hour | Day | |
| OpenStack Provider Instance | 3 Realtime Metrics | 181 (3 records * 60 minutes = 180 Realtime Metrics + 1 hourly Rollup Metric) | 4,345 (3 records * 60 minutes * 24 hours =4320 Realtime Metrics + 1 daily Rollup Metric) |
- Metrics data storage times can be configured by editing the Advanced Settings.
Browser Requirements
To use ManageIQ, the following browser requirements must be met:
-
One of the following web browsers:
-
Google Chrome
-
Mozilla Firefox
-
Safari
-
Internet Explorer 10 or higher
-
Additional Requirements
Additionally, the following must be configured to use ManageIQ:
-
The ManageIQ appliance must already be installed and activated in your enterprise environment.
-
The SmartProxy must have visibility into the virtual machines and cloud instances that you want to control.
-
For more information, see SmartProxies in the ManageIQ General Configuration guide.
Terminology
The following terms are used throughout the documentation. Review them before proceeding.
-
Account Role The level of access a user has to different parts and functions of the ManageIQ console. There are a variety of Account Roles, which can be assigned to users to restrict or allow access to parts of the console and virtual infrastructure.
-
Action An execution that is performed after a condition is evaluated.
-
Alert ManageIQ alerts notify administrators and monitoring systems of critical configuration changes and threshold limits in the virtual environment. The notification can take the form of either an email or an SNMP trap.
-
Analysis Profile A customized scan of hosts, virtual machines, or instances. You can collect information from categories, files, event logs, and registry entries.
-
Cloud A pool of on-demand and highly available computing resources. The usage of these resources are scaled depending on the user requirements and metered for cost.
-
ManageIQ Appliance A virtual machine where the virtual management database (VMDB) and ManageIQ reside.
-
ManageIQ Console A web-based interface into the ManageIQ appliance.
-
ManageIQ Role A designation assigned to a ManageIQ server that defines what a ManageIQ server can do.
-
ManageIQ Server The application that runs on the ManageIQ appliance and communicates with the SmartProxy and the VMDB.
-
Cluster Hosts that are grouped together to provide high availability and load balancing.
-
Condition A control policy test triggered by an event, which determines a subsequent action.
-
Discovery Process run by the ManageIQ server which finds virtual machine and cloud providers.
-
Drift The comparison of a virtual machine, instance, host, cluster to itself at different points in time.
-
Event A trigger to check a condition.
-
Event Monitor Software on the ManageIQ appliance which monitors external providers for events and sends them to the ManageIQ server.
-
Host A computer running a hypervisor, capable of hosting and monitoring virtual machines. Supported hypervisors include RHV-H, VMware ESX hosts, Windows Hyper-V hosts.
-
Instance/Cloud Instance A on-demand virtual machine based upon a predefined image and uses a scalable set of hardware resources such as CPU, memory, networking interfaces.
-
Managed/Registered VM A virtual machine that is connected to a host and exists in the VMDB. Also, a template that is connected to a provider and exists in the VMDB. Note that templates cannot be connected to a host.
-
Managed/Unregistered VM A virtual machine or template that resides on a repository or is no longer connected to a provider or host and exists in the VMDB. A virtual machine that was previously considered registered may become unregistered if the virtual machine was removed from provider inventory.
-
Provider An external management system that ManageIQ integrates in order to collect data and perform operations.
-
Policy A combination of an event, a condition, and an action used to manage a virtual machine.
-
Policy Profile A set of policies.
-
Refresh A process run by the ManageIQ server which checks for relationships of the provider or host to other resources, such as storage locations, repositories, virtual machines, or instances. It also checks the power states of those resources.
-
Regions A region is the collection of zones that share the same database for reporting and charting. A master region may be added to synchronize multiple VMDBs into one VMDB for higher-level reporting, providing a “single pane of glass” view.
-
Resource A host, provider, instance, virtual machine, repository, or datastore.
-
Resource Pool A group of virtual machines across which CPU and memory resources are allocated.
-
Repository A place on a datastore resource which contains virtual machines.
-
SmartProxy The SmartProxy is a software agent that acts on behalf of the ManageIQ appliance to perform actions on hosts, providers, storage and virtual machines.
- The SmartProxy can be configured to reside on the ManageIQ appliance or on an ESX server version. The SmartProxy can be deployed from the ManageIQ appliance, and provides visibility to the VMFS storage. Each storage location must have a SmartProxy with visibility to it. The SmartProxy acts on behalf of the ManageIQ appliance. If the SmartProxy is not embedded in the ManageIQ server, it communicates with the ManageIQ appliance over HTTPS on standard port 443.
-
SmartState Analysis Process run by the SmartProxy which collects the details of a virtual machine or instance. Such details include accounts, drivers, network information, hardware, and security patches. This process is also run by the ManageIQ server on hosts and clusters. The data is stored in the VMDB.
-
SmartTags Descriptors that allow you to create a customized, searchable index for the resources in your clouds and infrastructure.
-
Storage Location A device, such as a VMware datastore, where digital information resides that is connected to a resource.
-
Tags Descriptive terms defined by a ManageIQ user or the system used to categorize a resource.
-
Template A template is a copy of a preconfigured virtual machine, designed to capture installed software and software configurations, as well as the hardware configuration, of the original virtual machine.
-
Unmanaged Virtual Machine Files discovered on a datastore that do not have a virtual machine associated with them in the VMDB. These files may be registered to a provider that the ManageIQ server does not have configuration information on. Possible causes may be that the provider has not been discovered or that the provider has been discovered, but no security credentials have been provided.
-
Virtual Machine A software implementation of a system that functions similar to a physical machine. Virtual machines utilize the hardware infrastructure of a physical host, or a set of physical hosts, to provide a scalable and on-demand method of system provisioning.
-
Virtual Management Database (VMDB) Database used by the ManageIQ appliance to store information about your resources, users, and anything else required to manage your virtual enterprise.
-
Virtual Thumbnail An image in the web interface representing a resource, such as a provider or a virtual machine, showing the resource’s properties at a glance. Each virtual thumbnail is divided into quadrants, which provide information about the resource, such as its software and power state.
-
Worker Appliance A ManageIQ appliance dedicated to a role other than user interface or database.
-
Zones ManageIQ Infrastructure can be organized into zones to configure failover and to isolate traffic. Zones can be created based on your environment. Zones can be based on geographic location, network location, or function. When first started, new servers are put into the default zone. ## Planning
This guide provides some general guidelines to planning a deployment on ManageIQ. This includes creating multiple regions containing ManageIQ appliances, CPU sizing recommendations, database sizing recommendations, and database configuration.
Regions
Regions are used for centralizing data which is collected from public and private virtualization environments. A region is ultimately represented as a single database for the VMDB. Regions are particularly useful when multiple geographical locations need to be managed, as they enable all the data collection to happen at each particular location and avoid data collection traffic across slow links between networks.
When multiple regions are being used, each with their own unique ID, a master region can be created to centralize the data of all the children regions into a single master database. To do this, configure each child region to replicate its data to the master region database (the recommended region is 99, though any number up to three digits will work). This parent and child region is a one-to-many relationship.
Regions can contain multiple zones, which in turn contain appliances. Zones are used for further segregating network traffic along with enabling failover configurations. Each appliance has the capability to be configured for a number of specialized server roles. These roles are limited to the zone containing the appliance they run on.
Only one failover type of each server role can run in a zone. If multiple appliances have the same failover role, the extras are used as backups that activate only if the primary appliance fails. Non-failover server roles can run on multiple appliances simultaneously in a zone, so resources can be adjusted according to the workload those roles are responsible for.
The following diagram demonstrates an example of the multiple regions working together in a ManageIQ environment.
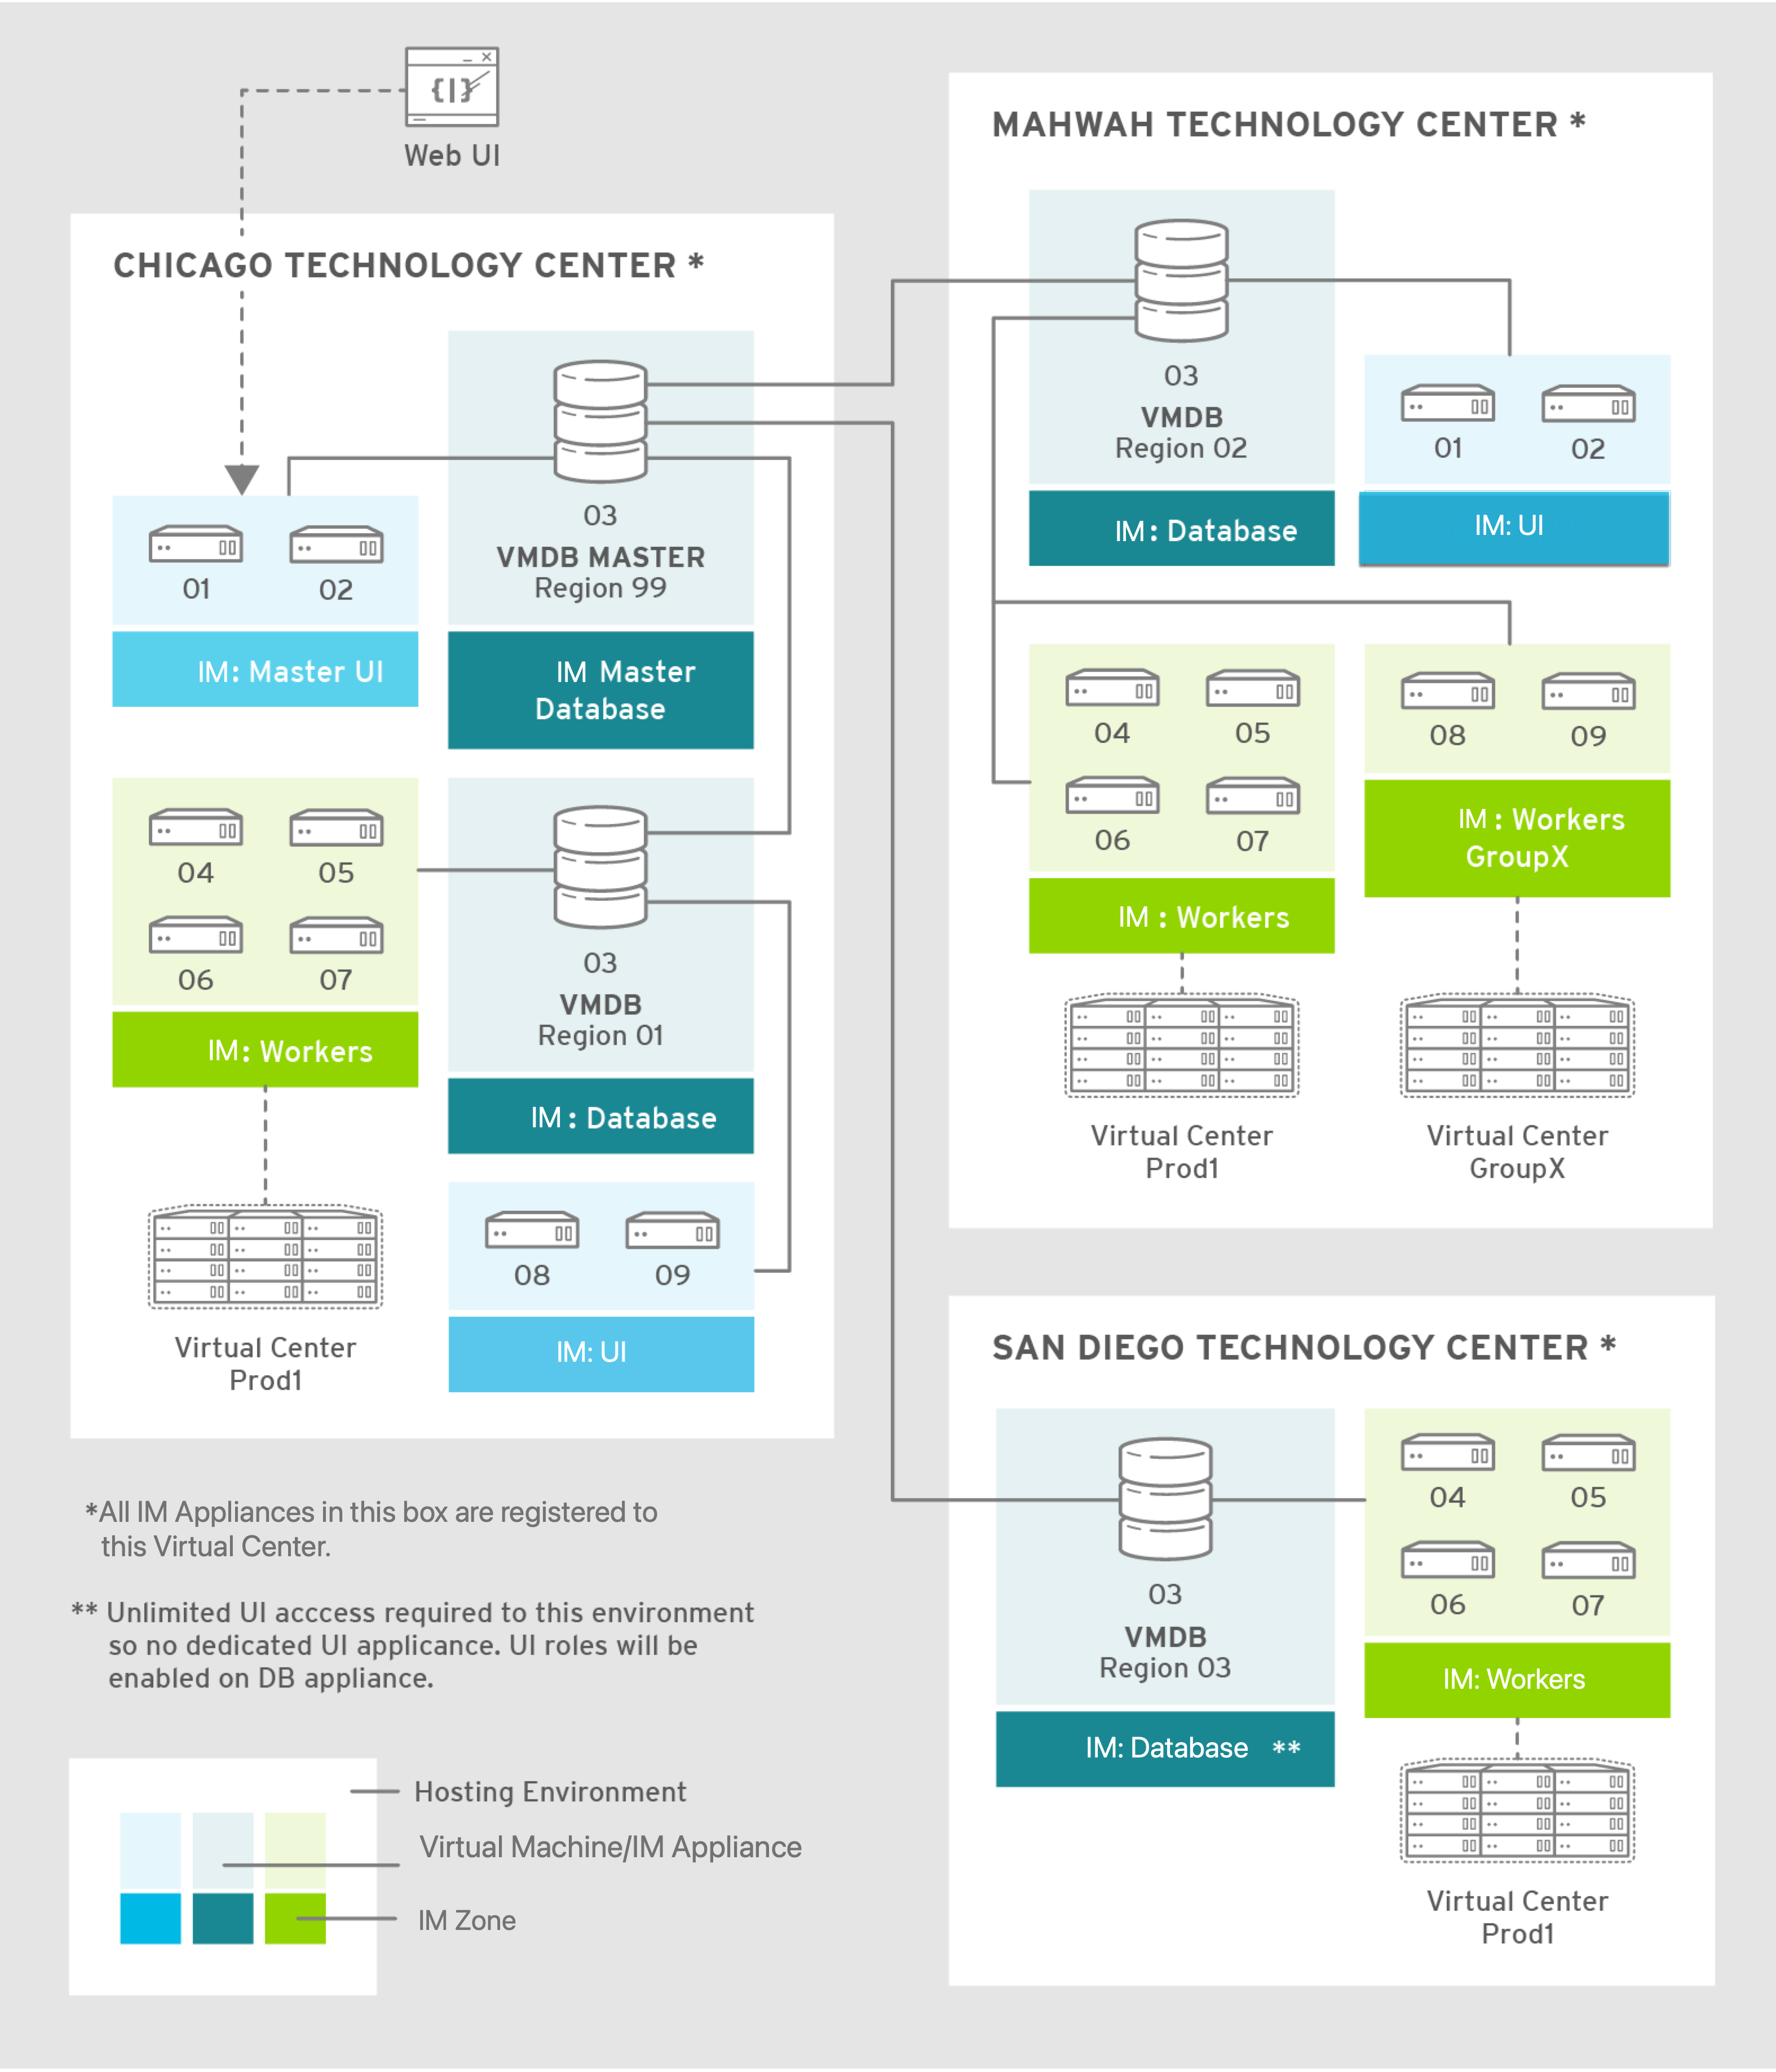
The master appliance is located in Chicago and contains a master region and a subregion that manages the worker appliances. The Mahwah technology center contains a single subregion that manages two zones. Likewise, the San Diego technology center contains a single subregion managing a single zone.
Note:
-
Replicating a parent region to a higher-level parent is not supported.
-
Parent regions can be configured after the child regions are online.
The following diagram provides a closer look at a region:

In this region, we have several ManageIQ appliances acting as UI nodes and worker nodes. These worker nodes execute tasks on the providers in your environment. The region also uses a region database that reports to a master database on the main ManageIQ appliance. All appliances can connect to the authentication services (Active Directory, LDAP, Identity Management), outgoing mail (SMTP), and network services (SNMP).
Note:
ManageIQ can be configured in a highly available setup. In this case, all PostgreSQL instances must be running on a server that is deployed from the ManageIQ appliance. High availability is achieved by database replication between two or more database servers.
Roles
Server roles define what a server can do. Assigning different server roles to appliances can allow them to focus on specific functions. When planning a deployment, consider which roles to assign to each appliance. Some server roles are enabled by default in ManageIQ. Many server roles start worker processes.
Some roles are also dependent on other roles. For example, because the ManageIQ user interface relies on the API for access, the Web Services role must be enabled with the User Interface role for users to log in to the appliance. See Server Roles in General Configuration for details on each server role and its function.
Appliance Types
Depending on the needs of your environment, you may choose to separate worker and database tasks between appliances. One example of this is to implement a highly available configuration so that certain appliances are running the PostgreSQL database and providing failover. For more details about configuring high availability, see the High Availability Guide.
The following provides a summary of types of appliances:
| Appliance Type | Database | Workers | Description |
|---|---|---|---|
| VMDB appliance | Yes | Yes | Worker processes are running, and it also hosts its own database that other appliances can connect to. |
| Non-database appliance | No | Yes | Worker processes are running on the appliance, but it does not host a database. The appliance is connected to an external database. |
| Dedicated-database appliance | Yes | No | This appliance contains no worker processes, only a database for other appliances to connect to. |
| Non-ManageIQ VM with database | Yes | No | This appliance contains no worker processes, only a database. As this is not a ManageIQ appliance, you cannot run any ManageIQ rake tasks on it. This appliance must be migrated using a non-database appliance that is pointed at it, using it as a database. |
Appliance types
Centralized Administration
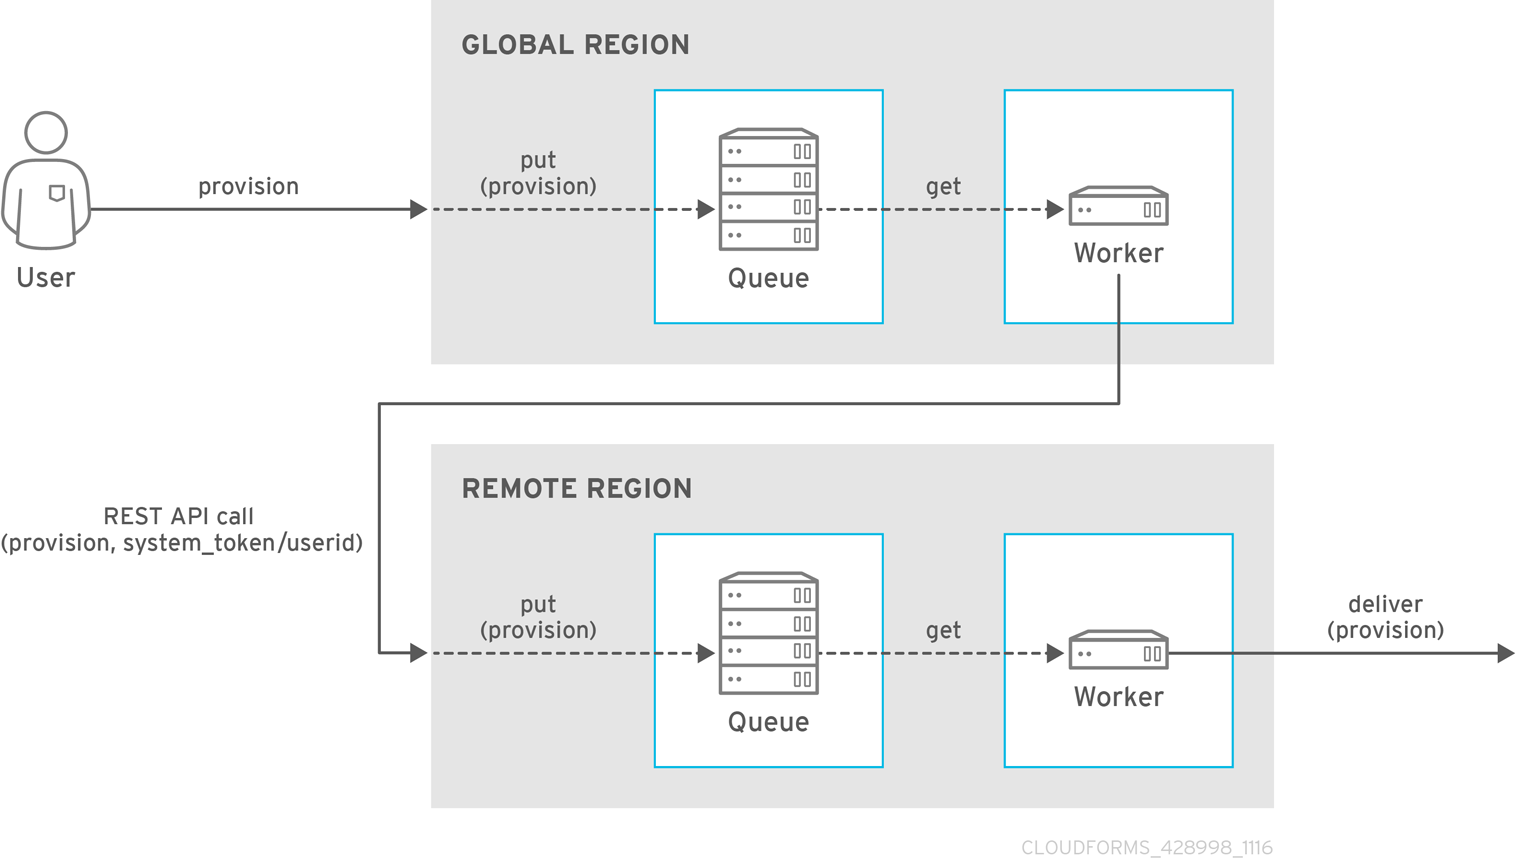
ManageIQ includes centralized administration capabilities, where certain operations can be initiated from the global region and processed and executed on remote regions. From the global region, you can also access the user interfaces of virtual machines residing in remote regions.
The following life cycle management operations can be initiated from the global region using centralized administration:
-
Virtual machine provisioning
-
Virtual machine power operations
-
Virtual machine retirement
-
Virtual machine reconfiguration
-
Service provisioning
-
Service retirement
-
Opening a virtual machine in the remote region
Note:
ManageIQ life cycle operations other than those listed above are not supported. Centralized administration capabilities are not supported from the Self Service user interface.
With centralized administration, the remote_queue_put leverages a new system-to-system REST API request to forward the original request to the remote region. This request is put in the local queue in the remote region, which is then delivered by a worker in the remote region as if it was queued there all along. As a result, a ManageIQ operator in the global region can be seen as provisioning on behalf of a remote region.
Note:
The operations initiated from the global region are subject to the role-based access control (RBAC) rules on the remote region. The user in the remote region which matches the logged-in user’s user ID will be used to enforce RBAC in the target region. The operation will fail on the remote system if the user does not have the required permissions.
Tenancy
ManageIQ supports multitenancy. Tenants can be totally separate or they can be in a parent-child or peer relationship. Tenants in a relationship can share or inherit a certain configuration. You can subdivide and create child tenants and they, in turn, can have child tenants, and so on. The ability to have multi-level (nested) tenants in a hierarchy enables those at the bottom to inherit permissions from those above. This configuration allows for granular user permissions to be set on specific tenants.
A tenant can also contain a self-contained child tenant known as a ‘project’. A project cannot have a child tenant, but is useful for allocating resources to a small group or team within a larger organization.
Note:
If you do not add any additional tenants, all resources and user accounts are contained in a single base tenant which is your ManageIQ appliance itself. In ManageIQ, this is sometimes referred to as ‘tenant zero’.
Tenancy Account Roles.
In ManageIQ, the following two account roles are associated with tenancy:
-
Tenant administrator
-
Tenant quota administrator
Tenancy Models.
The following two approaches exist for tenancy planning:
-
Tenantless - You can create a single large tenant, sometimes referred to as ‘tenant zero’, and perform all your operations in there without any subdivision of resources or user accounts.
-
Enterprise model - A common scenario is to create a single tenant, and then subdivide it based on the structures or departments within your organization. Those departments are then able to further subdivide their resources into distinct projects. With this model, you have a single URL for user access, while still having the ability to divide resources into nested hierarchical tenants.
Tenancy Configuration.
You can create and configure tenancy using the ManageIQ user interface in the same place you set up users, groups and roles by selecting Configuration from the settings menu, and then clicking on the Access Control accordion.
Tenancy in Automation.
One of the features of tenancy is that each tenant can have its own automate domain. Tenant-based domains can help in several use cases, such as if you have:
-
groups that need their own naming routines
-
varying types of approval needs
-
departments that use different end ticketing systems
-
a customer who is a holding company or centralized IT organization for managing different business units
Just like standard domains are nested, you can also add automate domains that are nested at the tenant level.
Tenancy Quota and Reporting.
You can allocate and enforce quotas for the following attributes:
-
Virtual CPUs
-
Memory in GB
-
Storage in GB
-
Number of virtual machines
-
Number of templates
You can generate or schedule a report for Tenant Quotas similar to other reports.
Note:
Currently, in tenant quota reports you will see all of the tenants but there is no nesting information available by parent and child tenants.
Example:
In the following example of a tenant quota report, DevOps Teams is a parent tenant and Team Alpha and Team Bravo are child tenants.
-
Total Quota: Total quota enforced per attribute for a tenant
-
In Use: Amount of quota currently in use by tenants
-
Allocated: Amount of quota given to all child tenants
-
Available: Total Quota minus (-) In Use minus (-) Allocated
Tenancy Chargeback.
You have the ability to do tenancy in chargeback where you are able to assign rates and have a different rate for each tenant. You can make use of the default rate or create your own set of rates depending on the tenant. As well, there is an ability to create chargeback reports by tenant.
Tenancy Service Catalogs.
Similar to automate domains, you can have service catalogs at each level of tenancy. Once you add a service catalog at a particular level of tenancy, it is visible to that tenant and its children (unless you use tagging to exclude).
Tenancy Providers.
Providers can be added at any level of tenancy. Once added, a provider is visible to any child or lower tenants, making it possible to easily separate resources that are owned or accessed by one group, and should not be available to other tenants.
Tenancy Relationships and Properties.
The tenant summary page found in Configuration > Access Control > Tenants > Tenant provides detailed information about the tenant and its relationships including:
-
Catalog items and bundles
-
Automate domains
-
Provider relationships
Using a Load Balancer
Deploying multiple user interface worker appliances and placing them behind a third-party load balancer allows for redundancy and improved performance. This requires extra configuration in both the load balancer and in the ManageIQ user interface worker appliances.
Configuring the Load Balancer
-
Configure the load balancer to use sticky sessions. This ensures that when a session is started, all requests for that session are sent to the same worker appliance.
-
Configure the load balancer to test for connectivity using the ManageIQ ping response page:
https://appliance_name/ping. The expected reply from the appliance is the text string pong. Using this URL is preferable to the appliance login URL as it does not establish a connection to the database.
Configuring Worker Appliances for Load Balancing
When using a load balancer, configure appliances that have the User Interface role enabled to store session data in the database. As a result, the user does not need to re-login if the load balancer redirects them to an alternative server in the case the original user interface worker is unresponsive.
On each appliance, configure the session data storage location using the
session_store parameter within the advanced settings page in the
ManageIQ user interface:
-
Click
 (Configuration).
 -
Click the Advanced tab.
-
Change the
session_storeparameter tosqlin the following line (the default parameter iscache)::server: ... :session_store: sql -
Click Save.
Database Configuration
This section describes the ManageIQ PostgreSQL database configuration. The below table provides information on each file: its location, primary function, and notes regarding behavior or recommendations.
| File | Location | Description | Note |
|---|---|---|---|
postgresql.conf |
Data Directory | Default server configuration | Adds directive to include /etc/manageiq/postgresql.conf.d directory |
postgresql.auto.conf |
Data Directory | Contains configuration set by the ALTER SYSTEM command |
Do not edit manually |
01_miq_overrides.conf |
/etc/manageiq/postgresql.conf.d |
Contains ManageIQ default overrides | Overwritten on upgrades |
| <other files> | /etc/manageiq/postgresql.conf.d |
Contains user overrides | Takes precedence if alphabetically after 01_miq_overrides.conf
|
Database files
User Overrides
Store custom configurations, or user overrides, in
/etc/manageiq/postgresql.conf.d. Name the user override file so that
it follows 01_miq_overrides.conf alphabetically. This ensures custom
configurations are not overwritten on ManageIQ upgrades.
The following file name example follows 01_miq_overrides.conf
alphabetically in the /etc/manageiq/postgresql.conf.d directory:
Example:
test_miq_overrides.conf
Reading Configuration Settings
Query the ManageIQ PostgreSQL database directly to read configuration settings. See the PostgreSQL Documentation for more information.
The following example queries the ManageIQ for current
value set for max_wal_senders:
Example:
`psql -d vmdb_production -c 'show max_wal_senders'`
Capacity Planning
Capacity and Utilization Collection
ManageIQ server can collect and analyze capacity and utilization data from your virtual infrastructure. Use this data to understand the limitations of your current environment and plan for growth.
For some capacity and utilization data, ManageIQ calculates and shows trend lines in the charts. Trend lines are created by using linear regression, which is calculated by using the capacity and utilization data that is collected by ManageIQ during the interval you specify for the chart. The more data that you have the better the predictive value of the trend line.
Three server roles are associated with the collection and metric creation of capacity and utilization.
-
The Capacity & Utilization Coordinator role checks to see whether it is time to collect data, somewhat like a scheduler. If it is time, a job is queued for the Capacity & Utilization Data Collector. The Coordinator role is required to complete capacity and utilization data collection. If more than one server in a specific zone has this role, only one is active at a time.
-
The Capacity & Utilization Data Collector performs the actual collection of capacity and utilization data. This role has a dedicated worker, and there can be more than one server with this role in a zone.
-
The Capacity & Utilization Data Processor processes all of the data that is collected, allowing ManageIQ to create charts. This role has a dedicated worker, and there can be more than one server with this role in a zone.
Assigning the Capacity and Utilization Server Roles
-
Click Configuration, then select the server to configure from menu: Settings > Zone in the accordion menu on the left.
-
Browse to the Server Roles list in the menu: Server > Server Control section. From there, set the required capacity and utilization roles to ON, namely:
-
Capacity & Utilization Coordinator
-
Capacity & Utilization Data Collector
-
Capacity & Utilization Data Processor
-
-
Click Save.
Data collection is enabled immediately. However, the first collection begins 5 minutes after the server is started, and every 10 minutes after that. Therefore, the longest the collection takes after enabling the Capacity & Utilization Collector role is 10 minutes. The first collection from a particular provider may take a few minutes since ManageIQ is gathering data points going one month back in time.
Note:
In addition to setting the server role, you must also select which clusters and data stores to collect data for. For more information, see the General Configuration guide. You must have super administrator privileges to edit these settings.
Adding Database Credentials for Data Collection
After you create the new user, add the user’s credentials to the settings for the provider.
-
From menu: Compute > Infrastructure > Providers, select an infrastructure provider to update its settings.
-
Click
 Configuration, and then
 Edit Selected Infrastructure Provider.
 -
In the Credentials area, click C & U Database.
-
Type in the credentials for the new database user you created.
-
Click Save.
-
Restart the Capacity and Utilization Data Collector.
Data Collection for Red Hat Virtualization
To collect capacity and utilization data for Red Hat Virtualization (RHV), you must add a user to the RHV-M history database for ManageIQ to use.
Perform this procedure on the PostgreSQL server where the history database (ovirt_engine_history) is located. Usually, this is the RHV-M server.
-
Using SSH, access the RHV-M database server as the root user:
$ ssh root@example.postgres.server -
Switch to the postgres user:
# su - postgresFor RHV 4.2 and 4.3, the PostgreSQL database is delivered as a software collection in version 9.5 and must be enabled first. Therefore, to run the following psql commands, you need to enable the *rh-postgresql95* collection and load into the current shell prompt by using the source command: $ source /opt/rh/rh-postgresql95/enable -
Create the user for ManageIQ to be granted read-only access to the history database:
$ psql -U postgres -c "CREATE ROLE example_role_name WITH LOGIN ENCRYPTED PASSWORD '[password]';" -d ovirt_engine_history -
Grant the newly created user permission to connect to the history database:
$ psql -U postgres -c "GRANT CONNECT ON DATABASE ovirt_engine_history TO example_role_name;" -
Grant the newly created user usage of the public schema:
$ psql -U postgres -c "GRANT USAGE ON SCHEMA public TO example_role_name;" ovirt_engine_history -
Generate the rest of the permissions that will be granted to the newly created user and save them to a file:
$ psql -U postgres -c "SELECT 'GRANT SELECT ON ' || relname || ' TO example_role_name;' FROM pg_class JOIN pg_namespace ON pg_namespace.oid = pg_class.relnamespace WHERE nspname = 'public' AND relkind IN ('r', 'v', 'S');" --pset=tuples_only=on ovirt_engine_history > grant.sql -
Use the file that you created in the previous step to grant permissions to the newly created user:
$ psql -U postgres -f grant.sql ovirt_engine_history -
Remove the file that you used to grant permissions to the newly created user:
$ rm grant.sql -
Exit to the RHV-M database server prompt:
$ exit -
Update the server’s firewall to accept TCP communication on port 5432:
# firewall-cmd --add-port=5432/tcp --permanent -
Enable external md5 authentication.
-
For RHV 4.0, 4.1, and 4.4 update the following line in
/var/lib/pgsql/data/pg_hba.conf:host all all 0.0.0.0/0 md5 -
For RHV 4.2 and 4.3, update the following line in
/var/opt/rh/rh-postgresql95/lib/pgsql/data/pg_hba.conf:host all all 0.0.0.0/0 md5
-
-
Enable PostgreSQL to listen for remote connections.
-
For RHV 4.0, 4.1, and 4.4 ensure the
listen_addressesline in/var/lib/pgsql/data/postgresql.confmatches the following example:listen_addresses = '*' -
For RHV 4.2 and 4.3, ensure the
listen_addressesline in/var/opt/rh/rh-postgresql95/lib/pgsql/data/postgresql.confmatches the following example:listen_addresses = '*'
-
-
Reload the PostgreSQL configuration.
-
For RHV 4.0, 4.1, and 4.4:
# systemctl reload postgresql -
For RHV 4.2 and 4.3:
# systemctl reload rh-postgresql95-postgresql
-
Data Collection for Red Hat Enterprise Linux OpenStack Platform
Before you can collect data from a Red Hat Enterprise Linux OpenStack Platform (RHEL-OSP) provider, you must install Ceilometer and configure it to accept queries from external systems.
These instructions require a Red Hat Enterprise Linux 6.4 @base
installation of RHEL-OSP and registration to a satellite that has access to both the RHEL-OSP and RHEL Server Optional channels. Perform all steps on your RHEL-OSP system.
-
Add the required channels and update your system:
# rhn-channel --add -c rhel-x86_64-server-6-ost-3 -c rhel-x86_64-server-optional-6 # yum update -y # reboot -
Install
Ceilometer:# yum install *ceilometer* -
Install and start the MongoDB store:
# yum install mongodb-server # sed -i '/--smallfiles/!s/OPTIONS=\"/OPTIONS=\"--smallfiles /' /etc/sysconfig/mongod # service mongod start -
Create the following users and roles:
# SERVICE_TENANT=$(keystone tenant-list | grep services | awk '{print $2}') # ADMIN_ROLE=$(keystone role-list | grep ' admin ' | awk '{print $2}') # SERVICE_PASSWORD=servicepass # CEILOMETER_USER=$(keystone user-create --name=ceilometer \ --pass="$SERVICE_PASSWORD" \ --tenant_id $SERVICE_TENANT \ --email=ceilometer@example.com | awk '/ id / {print $4}') # RESELLER_ROLE=$(keystone role-create --name=ResellerAdmin | awk '/ id / {print $4}') # ADMIN_ROLE=$(keystone role-list | awk '/ admin / {print $2}') # for role in $RESELLER_ROLE $ADMIN_ROLE ; do keystone user-role-add --tenant_id $SERVICE_TENANT \ --user_id $CEILOMETER_USER --role_id $role done -
Configure the authtoken in
ceilometer.conf:# openstack-config --set /etc/ceilometer/ceilometer.conf keystone_authtoken auth_host 127.0.0.1 # openstack-config --set /etc/ceilometer/ceilometer.conf keystone_authtoken auth_port 35357 # openstack-config --set /etc/ceilometer/ceilometer.conf keystone_authtoken auth_protocol http # openstack-config --set /etc/ceilometer/ceilometer.conf keystone_authtoken admin_tenant_name services # openstack-config --set /etc/ceilometer/ceilometer.conf keystone_authtoken admin_user ceilometer # openstack-config --set /etc/ceilometer/ceilometer.conf keystone_authtoken admin_password $SERVICE_PASSWORD -
Configure the user credentials in
ceilometer.conf:# openstack-config --set /etc/ceilometer/ceilometer.conf DEFAULT os_auth_url http://127.0.0.1:35357/v2.0 # openstack-config --set /etc/ceilometer/ceilometer.conf DEFAULT os_tenant_name services # openstack-config --set /etc/ceilometer/ceilometer.conf DEFAULT os_password $SERVICE_PASSWORD # openstack-config --set /etc/ceilometer/ceilometer.conf DEFAULT os_username ceilometer -
Start the Ceilometer services:
# for svc in compute central collector api ; do service openstack-ceilometer-$svc start done -
Register an endpoint with the service catalog. Replace
$EXTERNALIFACEwith the IP address of your external interface:# keystone service-create --name=ceilometer \ --type=metering --description="Ceilometer Service" # CEILOMETER_SERVICE=$(keystone service-list | awk '/ceilometer/ {print $2}') # keystone endpoint-create \ --region RegionOne \ --service_id $CEILOMETER_SERVICE \ --publicurl "http://$EXTERNALIFACE:8777/" \ --adminurl "http://$EXTERNALIFACE:8777/" \ --internalurl "http://localhost:8777/" -
Enable access to Ceilometer from external systems:
# iptables -I INPUT -p tcp -m multiport --dports 8777 -m comment --comment "001 ceilometer incoming" -j ACCEPT # iptables save -
Confirm the status of OpenStack and the Ceilometer services:
# openstack-status # for svc in compute central collector api ; do service openstack-ceilometer-$svc status done -
Verify that Ceilometer is working correctly by authenticating as a user with running instances, for example
admin. Pipe the sample for the CPU meter to count lines, and confirm that the value changes according to the interval specified in/etc/ceilometer/pipeline.yaml. The default interval is 600 seconds.# . ~/keystonerc_admin # ceilometer sample-list -m cpu |wc -l -
Add the configured OpenStack provider to ManageIQ. After adding the provider, capacity and utilization data for your instances will populate in a few minutes.
Capacity and Utilization Data Collected
ManageIQ generates charts from the collected data that can be used to plan your hardware and virtual machine needs. Depending on the type of data, these charts can include lines for averages, maximums, minimums, and trends.
Note:
For reporting of daily capacity and utilization data, incomplete days (days with less than 24 hourly data points from midnight to midnight) that are at the beginning or end of the requested interval are excluded. Days with less than 24 hourly data points would be inaccurate and including them would skew trend lines. Therefore, at least one full day of hourly data from midnight to midnight is necessary for displaying the capacity and utilization charts under the menu: Compute > Infrastructure tab.
Capacity and Utilization Charts for Hosts, Clusters, and Virtual Machines
| Resource Type | CPU Usage | CPU States | Disk I/O | Memory Usage | Network I/O | Running VMS | Running Hosts |
|---|---|---|---|---|---|---|---|
| Host | Y | Y | Y | Y | Y | Y | NA |
| Cluster | Y | Y | Y | Y | Y | Y | Y |
| Virtual Machine | Y | Y | Y | Y | Y | NA | NA |
Capacity and Utilization Charts for Hosts, Clusters, and Virtual Machines
Capacity and Utilization Charts for Datastores
Charts that are created include:
| Space by VM Type | Virtual Machines and Hosts |
|---|---|
| Used Space | Number of VMs by Type |
| Disk files Space | Hosts |
| Snapshot Files Space | Virtual Machines |
| Memory Files Space | |
| Non-VM Files | |
| Used Disk Space |
Capacity and Utilization Charts for Datastores
Capacity and Utilization Chart Features
Capacity and utilization charts for host, clusters, virtual machines, and datastore provides its own set of special features that include zooming in on a chart and shortcut menus.
Zooming into a Chart
-
Browse to the chart you want to zoom. If you hover anywhere on the chart, two dashed lines appear to target a coordinate of the chart.
-
Click
 (Click to zoom in) in the lower left corner of the chart to zoom into it.
 -
To go back to the regular view click
 (Click to zoom out) on the enlarged chart.
Drilling into Chart Data
-
Browse to the chart you want to get more detail from.
-
Hover over a data point to see the coordinates.
-
Click a data point to open a shortcut menu for the chart. In this example, you can use the shortcut menu to go to the hourly chart or display the virtual machines that were running at the time the data was captured.
-
If you are viewing the CPU, Disk, Memory, or Network charts, selecting from the Chart option will change all of the charts on the page to the new interval selected.
-
If you are viewing the CPU, Disk, Memory, or Network charts, selecting from the Display option will allow you to drill into the virtual machines or Hosts that were running at the time.
-
If you are viewing the VM or Hosts chart, the Display menu allows you to view running or stopped virtual machines. The time of the data point will be displayed in addition to the virtual machines that apply. From here, click a virtual machine to view its details.
-
Planning Where to Put a New Virtual Machine
You can use the data that is collected in the VMDB to plan where you can put more virtual machines. With ManageIQ, you can use a reference virtual machine as an example to plan on which hosts and clusters you can place a new virtual machine.
Note: For more information about utilization trends and identifying bottlenecks in your environment, see Data Optimization in Managing Infrastructure and Inventory.
- Browse to Optimize > Planning.
-
From Reference VM Selection, use the drop-down menu to select the virtual machine that is most like the one that you want to add.
-
Select the required VM Options for what you want to base the calculations on.
From the Source list, select the type of data to use as the source for your projections. For example, select Allocation to calculate based on the current allocation values of each resource (CPU, memory, or disk space) for the reference virtual machine. Use Reservation to project based on the current guaranteed value of the specific resource (CPU Speed, CPU count, memory, or disk space) although that amount might not be allocated to the virtual machine at a specific moment in time. Select Usage if you want to calculate based on usage history of the reference virtual machine. Use Manual Input to enter your own set of parameters for each resource.
-
From Target Options / Limits, select if you want to use clusters or hosts as your targets.
Also, select the limit of how high the projection can go for CPU, memory, and datastore space. If you are targeting hosts, you are able to select a filter for which hosts can be targets.
- From Trend Options, select how far back you want to use the trend data for, a Time Profile and Time Zone if applicable. Note that Time Profile will only show if the logged on user has a Time Profile available.
- Click Submit.
The Summary tab shows the best clusters or hosts on which to place the virtual machines. The Report tab shows the best fit and statistics on the reference virtual machine in a tabular format. From the Report tab, you can also create a PDF of the report or download the data in txt or csv format.
Appendix
Example PostgreSQL Configuration File
# -----------------------------
# PostgreSQL configuration file - MIQ Dedicated Appliance Configuration
# -----------------------------
#
# This file consists of lines of the form:
#
#   name = value
#
# (The "=" is optional.)  Whitespace may be used.  Comments are introduced with
# "#" anywhere on a line.  The complete list of parameter names and allowed
# values can be found in the PostgreSQL documentation.
#
# The commented-out settings shown in this file represent the default values.
# Re-commenting a setting is NOT sufficient to revert it to the default value;
# you need to reload the server.
#
# This file is read on server startup and when the server receives a SIGHUP
# signal.  If you edit the file on a running system, you have to SIGHUP the
# server for the changes to take effect, or use "pg_ctl reload".  Some
# parameters, which are marked below, require a server shutdown and restart to
# take effect.
#
# Any parameter can also be given as a command-line option to the server, e.g.,
# "postgres -c log_connections=on".  Some parameters can be changed at run time
# with the "SET" SQL command.
#
# Memory units:  kB = kilobytes        Time units:  ms  = milliseconds
#                MB = megabytes                     s   = seconds
#                GB = gigabytes                     min = minutes
#                                                   h   = hours
#                                                   d   = days


#------------------------------------------------------------------------------
# FILE LOCATIONS
#------------------------------------------------------------------------------

# The default values of these variables are driven from the -D command-line
# option or PGDATA environment variable, represented here as ConfigDir.

#data_directory = 'ConfigDir'       # use data in another directory
                    # (change requires restart)
#hba_file = 'ConfigDir/pg_hba.conf' # host-based authentication file
                    # (change requires restart)
#ident_file = 'ConfigDir/pg_ident.conf' # ident configuration file
                    # (change requires restart)

# If external_pid_file is not explicitly set, no extra PID file is written.
#external_pid_file = '(none)'       # write an extra PID file
                    # (change requires restart)


#------------------------------------------------------------------------------
# CONNECTIONS AND AUTHENTICATION
#------------------------------------------------------------------------------

# - Connection Settings -

listen_addresses = '10.132.50.128'  # MIQ Value;
#listen_addresses = 'localhost'     # what IP address(es) to listen on;
                    # comma-separated list of addresses;
                    # defaults to 'localhost', '*' = all
                    # (change requires restart)
#port = 5432                # (change requires restart)
max_connections = 1600          # MIQ Value increased
#max_connections = 100          # (change requires restart) Note:  Increasing max_connections costs ~400 bytes of shared memory per connection slot, plus lock space (see max_locks_per_transaction).
#superuser_reserved_connections = 3 # (change requires restart)
#unix_socket_directory = ''     # (change requires restart)
#unix_socket_group = ''         # (change requires restart)
#unix_socket_permissions = 0777     # begin with 0 to use octal notation
                    # (change requires restart)
#bonjour = off              # advertise server via Bonjour
                    # (change requires restart)
#bonjour_name = ''          # defaults to the computer name
                    # (change requires restart)

# - Security and Authentication -

#authentication_timeout = 1min      # 1s-600s
#ssl = off              # (change requires restart)
#ssl_ciphers = 'ALL:!ADH:!LOW:!EXP:!MD5:@STRENGTH'  # allowed SSL ciphers
                    # (change requires restart)
#ssl_renegotiation_limit = 512MB    # amount of data between renegotiations
#password_encryption = on
#db_user_namespace = off

# Kerberos and GSSAPI
#krb_server_keyfile = ''
#krb_srvname = 'postgres'       # (Kerberos only)
#krb_caseins_users = off

# - TCP Keepalives -
# see "man 7 tcp" for details

tcp_keepalives_idle = 3         # MIQ Value;
#tcp_keepalives_idle = 0        # TCP_KEEPIDLE, in seconds;
                    # 0 selects the system default
tcp_keepalives_interval = 75        # MIQ Value;
#tcp_keepalives_interval = 0        # TCP_KEEPINTVL, in seconds;
                    # 0 selects the system default
tcp_keepalives_count = 9        # MIQ Value;
#tcp_keepalives_count = 0       # TCP_KEEPCNT;
                    # 0 selects the system default


#------------------------------------------------------------------------------
# RESOURCE USAGE (except WAL)
#------------------------------------------------------------------------------

# - Memory -

#shared_buffers = 128MB         # MIQ Value SHARED CONFIGURATION
shared_buffers = 4GB            # MIQ Value DEDICATED CONFIGURATION increased
#shared_buffers = 32MB          # min 128kB
                    # (change requires restart)
#temp_buffers = 8MB         # min 800kB
#max_prepared_transactions = 0      # zero disables the feature
                    # (change requires restart)
# Note:  Increasing max_prepared_transactions costs ~600 bytes of shared memory
# per transaction slot, plus lock space (see max_locks_per_transaction).
# It is not advisable to set max_prepared_transactions nonzero unless you
# actively intend to use prepared transactions.
#work_mem = 1MB             # min 64kB
#maintenance_work_mem = 16MB        # min 1MB
#max_stack_depth = 2MB          # min 100kB

# - Kernel Resource Usage -

#max_files_per_process = 1000       # min 25
                    # (change requires restart)
#shared_preload_libraries = ''      # (change requires restart)

# - Cost-Based Vacuum Delay -

#vacuum_cost_delay = 0ms        # 0-100 milliseconds
#vacuum_cost_page_hit = 1       # 0-10000 credits
#vacuum_cost_page_miss = 10     # 0-10000 credits
#vacuum_cost_page_dirty = 20        # 0-10000 credits
#vacuum_cost_limit = 200        # 1-10000 credits

# - Background Writer -

#bgwriter_delay = 200ms         # 10-10000ms between rounds
#bgwriter_lru_maxpages = 100        # 0-1000 max buffers written/round
#bgwriter_lru_multiplier = 2.0      # 0-10.0 multipler on buffers scanned/round

# - Asynchronous Behavior -

#effective_io_concurrency = 1       # 1-1000. 0 disables prefetching


#------------------------------------------------------------------------------
# WRITE AHEAD LOG
#------------------------------------------------------------------------------

# - Settings -

#wal_level = minimal            # minimal, archive, or hot_standby
                    # (change requires restart)
#fsync = on             # turns forced synchronization on or off
#synchronous_commit = on        # synchronization level; on, off, or local
#wal_sync_method = fsync        # the default is the first option
                    # supported by the operating system:
                    #   open_datasync
                    #   fdatasync (default on Linux)
                    #   fsync
                    #   fsync_writethrough
                    #   open_sync
#full_page_writes = on          # recover from partial page writes
wal_buffers = 16MB          # MIQ Value;
#wal_buffers = -1           # min 32kB, -1 sets based on shared_buffers
                    # (change requires restart)
#wal_writer_delay = 200ms       # 1-10000 milliseconds

#commit_delay = 0           # range 0-100000, in microseconds
#commit_siblings = 5            # range 1-1000

# - Checkpoints -

checkpoint_segments = 15        # MIQ Value;
#checkpoint_segments = 3        # in logfile segments, min 1, 16MB each
#checkpoint_timeout = 5min      # range 30s-1h
checkpoint_completion_target = 0.9  # MIQ Value;
#checkpoint_completion_target = 0.5 # checkpoint target duration, 0.0 - 1.0
#checkpoint_warning = 30s       # 0 disables

# - Archiving -

#archive_mode = off     # allows archiving to be done
                # (change requires restart)
#archive_command = ''       # command to use to archive a logfile segment
#archive_timeout = 0        # force a logfile segment switch after this
                # number of seconds; 0 disables


#------------------------------------------------------------------------------
# REPLICATION
#------------------------------------------------------------------------------

# - Master Server -

# These settings are ignored on a standby server

#max_wal_senders = 0        # max number of walsender processes
                # (change requires restart)
#wal_sender_delay = 1s      # walsender cycle time, 1-10000 milliseconds
#wal_keep_segments = 0      # in logfile segments, 16MB each; 0 disables
#vacuum_defer_cleanup_age = 0   # number of xacts by which cleanup is delayed
#replication_timeout = 60s  # in milliseconds; 0 disables
#synchronous_standby_names = '' # standby servers that provide sync rep
                # comma-separated list of application_name
                # from standby(s); '*' = all

# - Standby Servers -

# These settings are ignored on a master server

#hot_standby = off          # "on" allows queries during recovery
                    # (change requires restart)
#max_standby_archive_delay = 30s    # max delay before canceling queries
                    # when reading WAL from archive;
                    # -1 allows indefinite delay
#max_standby_streaming_delay = 30s  # max delay before canceling queries
                    # when reading streaming WAL;
                    # -1 allows indefinite delay
#wal_receiver_status_interval = 10s # send replies at least this often
                    # 0 disables
#hot_standby_feedback = off     # send info from standby to prevent
                    # query conflicts


#------------------------------------------------------------------------------
# QUERY TUNING
#------------------------------------------------------------------------------

# - Planner Method Configuration -

#enable_bitmapscan = on
#enable_hashagg = on
#enable_hashjoin = on
#enable_indexscan = on
#enable_material = on
#enable_mergejoin = on
#enable_nestloop = on
#enable_seqscan = on
#enable_sort = on
#enable_tidscan = on

# - Planner Cost Constants -

#seq_page_cost = 1.0            # measured on an arbitrary scale
#random_page_cost = 4.0         # same scale as above
#cpu_tuple_cost = 0.01          # same scale as above
#cpu_index_tuple_cost = 0.005       # same scale as above
#cpu_operator_cost = 0.0025     # same scale as above
#effective_cache_size = 128MB

# - Genetic Query Optimizer -

#geqo = on
#geqo_threshold = 12
#geqo_effort = 5            # range 1-10
#geqo_pool_size = 0         # selects default based on effort
#geqo_generations = 0           # selects default based on effort
#geqo_selection_bias = 2.0      # range 1.5-2.0
#geqo_seed = 0.0            # range 0.0-1.0

# - Other Planner Options -

#default_statistics_target = 100    # range 1-10000
#constraint_exclusion = partition   # on, off, or partition
#cursor_tuple_fraction = 0.1        # range 0.0-1.0
#from_collapse_limit = 8
#join_collapse_limit = 8        # 1 disables collapsing of explicit
                    # JOIN clauses


#------------------------------------------------------------------------------
# ERROR REPORTING AND LOGGING
#------------------------------------------------------------------------------

# - Where to Log -


log_destination = 'stderr'      # Valid values are combinations of
                    # stderr, csvlog, syslog, and eventlog,
                    # depending on platform.  csvlog
                    # requires logging_collector to be on.

# This is used when logging to stderr:
logging_collector = on      # Enable capturing of stderr and csvlog
                    # into log files. Required to be on for
                    # csvlogs.
                    # (change requires restart)

# These are only used if logging_collector is on:
log_directory = '/www/postgres/log' # Customer specific setting
#log_directory = 'log'       # directory where log files are written,
                    # can be absolute or relative to PGDATA
log_filename = 'postgresql-%Y-%m-%d.log'        # log file name pattern,
                    # can include strftime() escapes
log_file_mode = 0644                    # creation mode for log files,
                    # begin with 0 to use octal notation
log_truncate_on_rotation = on           # If on, an existing log file with the
                    # same name as the new log file will be
                    # truncated rather than appended to.
                    # But such truncation only occurs on
                    # time-driven rotation, not on restarts
                    # or size-driven rotation.  Default is
                    # off, meaning append to existing files
                    # in all cases.
log_rotation_age = 1d                   # Automatic rotation of logfiles will
                    # happen after that time.  0 disables.
log_rotation_size = 0                   # Automatic rotation of logfiles will
                    # happen after that much log output.
                    # 0 disables.

# These are relevant when logging to syslog:
#syslog_facility = 'LOCAL0'
#syslog_ident = 'postgres'

#silent_mode = off          # Run server silently.
                    # DO NOT USE without syslog or
                    # logging_collector
                    # (change requires restart)


# - When to Log -

#client_min_messages = notice       # values in order of decreasing detail:
                    #   debug5
                    #   debug4
                    #   debug3
                    #   debug2
                    #   debug1
                    #   log
                    #   notice
                    #   warning
                    #   error

#log_min_messages = warning     # values in order of decreasing detail:
                    #   debug5
                    #   debug4
                    #   debug3
                    #   debug2
                    #   debug1
                    #   info
                    #   notice
                    #   warning
                    #   error
                    #   log
                    #   fatal
                    #   panic

#log_min_error_statement = error    # values in order of decreasing detail:
                    #   debug5
                    #   debug4
                    #   debug3
                    #   debug2
                    #   debug1
                    #   info
                    #   notice
                    #   warning
                    #   error
                    #   log
                    #   fatal
                    #   panic (effectively off)

log_min_duration_statement = 5000   # MIQ Value- ANY statement > 5 seconds
#log_min_duration_statement = -1    # -1 is disabled, 0 logs all statements
                    # and their durations, > 0 logs only
                    # statements running at least this number
                    # of milliseconds


# - What to Log -

#debug_print_parse = off
#debug_print_rewritten = off
#debug_print_plan = off
#debug_pretty_print = on
#log_checkpoints = off
#log_connections = off
#log_disconnections = off
#log_duration = off
#log_error_verbosity = default      # terse, default, or verbose messages
#log_hostname = off
log_line_prefix = '%t:%r:%c:%u@%d:[%p]:'    # MIQ Value;
#log_line_prefix = ''           # special values:
                    #   %a = application name
                    #   %u = user name
                    #   %d = database name
                    #   %r = remote host and port
                    #   %h = remote host
                    #   %p = process ID
                    #   %t = timestamp without milliseconds
                    #   %m = timestamp with milliseconds
                    #   %i = command tag
                    #   %e = SQL state
                    #   %c = session ID
                    #   %l = session line number
                    #   %s = session start timestamp
                    #   %v = virtual transaction ID
                    #   %x = transaction ID (0 if none)
                    #   %q = stop here in non-session
                    #        processes
                    #   %% = '%'
                    # e.g. '<%u%%%d> '
log_lock_waits = on         # MIQ Value - used to track possible deadlock issues
#log_lock_waits = off           # log lock waits >= deadlock_timeout
#log_statement = 'none'         # none, ddl, mod, all
#log_temp_files = -1            # log temporary files equal or larger
                    # than the specified size in kilobytes;
                    # -1 disables, 0 logs all temp files
#log_timezone = '(defaults to server environment setting)'


#------------------------------------------------------------------------------
# RUNTIME STATISTICS
#------------------------------------------------------------------------------

# - Query/Index Statistics Collector -

#track_activities = on
track_counts = on           # MIQ Value;
#track_counts = on
#track_functions = none         # none, pl, all
#track_activity_query_size = 1024   # (change requires restart)
#update_process_title = on
#stats_temp_directory = 'pg_stat_tmp'


# - Statistics Monitoring -

#log_parser_stats = off
#log_planner_stats = off
#log_executor_stats = off
#log_statement_stats = off


#------------------------------------------------------------------------------
# AUTOVACUUM PARAMETERS
#------------------------------------------------------------------------------

autovacuum = on             # MIQ Value;
#autovacuum = on            # Enable autovacuum subprocess?  'on'
                    # requires track_counts to also be on.
log_autovacuum_min_duration = 0     # MIQ Value;
#log_autovacuum_min_duration = -1   # -1 disables, 0 logs all actions and
                    # their durations, > 0 logs only
                    # actions running at least this number
                    # of milliseconds.
autovacuum_max_workers = 1      # max number of autovacuum subprocesses
                    # (change requires restart)
autovacuum_naptime = 30min      # MIQ Value;
#autovacuum_naptime = 1min      # time between autovacuum runs
autovacuum_vacuum_threshold = 500   # MIQ Value;
#autovacuum_vacuum_threshold = 50   # min number of row updates before
                    # vacuum
autovacuum_analyze_threshold = 500  # MIQ Value;
#autovacuum_analyze_threshold = 50  # min number of row updates before
                    # analyze
autovacuum_vacuum_scale_factor = 0.05   # MIQ Value;
#autovacuum_vacuum_scale_factor = 0.2   # fraction of table size before vacuum
#autovacuum_analyze_scale_factor = 0.1  # fraction of table size before analyze
#autovacuum_freeze_max_age = 200000000  # maximum XID age before forced vacuum
                    # (change requires restart)
#autovacuum_vacuum_cost_delay = 20ms    # default vacuum cost delay for
                    # autovacuum, in milliseconds;
                    # -1 means use vacuum_cost_delay
#autovacuum_vacuum_cost_limit = -1  # default vacuum cost limit for
                    # autovacuum, -1 means use
                    # vacuum_cost_limit


#------------------------------------------------------------------------------
# CLIENT CONNECTION DEFAULTS
#------------------------------------------------------------------------------

# - Statement Behavior -

#search_path = '"$user",public'     # schema names
#default_tablespace = ''        # a tablespace name, '' uses the default
#temp_tablespaces = ''          # a list of tablespace names, '' uses
                    # only default tablespace
#check_function_bodies = on
#default_transaction_isolation = 'read committed'
#default_transaction_read_only = off
#default_transaction_deferrable = off
#session_replication_role = 'origin'
#statement_timeout = 0          # in milliseconds, 0 is disabled
#statement_timeout = 43200000           # MIQ statment timeout of 12 hours as a default
#vacuum_freeze_min_age = 50000000
#vacuum_freeze_table_age = 150000000
#bytea_output = 'hex'           # hex, escape
#xmlbinary = 'base64'
#xmloption = 'content'

# - Locale and Formatting -

datestyle = 'iso, mdy'
#intervalstyle = 'postgres'
#timezone = '(defaults to server environment setting)'
#timezone_abbreviations = 'Default'     # Select the set of available time zone
                    # abbreviations.  Currently, there are
                    #   Default
                    #   Australia
                    #   India
                    # You can create your own file in
                    # share/timezonesets/.
#extra_float_digits = 0         # min -15, max 3
#client_encoding = sql_ascii        # actually, defaults to database
                    # encoding

# These settings are initialized by initdb, but they can be changed.
lc_messages = 'en_US.UTF-8'         # locale for system error message
                    # strings
lc_monetary = 'en_US.UTF-8'         # locale for monetary formatting
lc_numeric = 'en_US.UTF-8'          # locale for number formatting
lc_time = 'en_US.UTF-8'             # locale for time formatting

# default configuration for text search
default_text_search_config = 'pg_catalog.english'

# - Other Defaults -

#dynamic_library_path = '$libdir'
#local_preload_libraries = ''


#------------------------------------------------------------------------------
# LOCK MANAGEMENT
#------------------------------------------------------------------------------

deadlock_timeout = 5s           # MIQ Value - one second is too low, 5 seconds is more "interesting"
#deadlock_timeout = 1s
#max_locks_per_transaction = 64     # min 10
                    # (change requires restart)
# Note:  Each lock table slot uses ~270 bytes of shared memory, and there are
# max_locks_per_transaction * (max_connections + max_prepared_transactions)
# lock table slots.
#max_pred_locks_per_transaction = 64    # min 10
                    # (change requires restart)

#------------------------------------------------------------------------------
# VERSION/PLATFORM COMPATIBILITY
#------------------------------------------------------------------------------

# - Previous PostgreSQL Versions -

#array_nulls = on
#backslash_quote = safe_encoding    # on, off, or safe_encoding
#default_with_oids = off
escape_string_warning = off     # MIQ Value no sure why this is enabled
#escape_string_warning = on
#lo_compat_privileges = off
#quote_all_identifiers = off
#sql_inheritance = on
standard_conforming_strings = off   # MIQ Value not sure why this is enabled
#standard_conforming_strings = on
#synchronize_seqscans = on

# - Other Platforms and Clients -

#transform_null_equals = off


#------------------------------------------------------------------------------
# ERROR HANDLING
#------------------------------------------------------------------------------

#exit_on_error = off                # terminate session on any error?
#restart_after_crash = on           # reinitialize after backend crash?


#------------------------------------------------------------------------------
# CUSTOMIZED OPTIONS
#------------------------------------------------------------------------------

#custom_variable_classes = ''       # list of custom variable class names