- Self Service User Interface Guide
- ManageIQ Self Service
- Accessing the Self Service User Interface
- Navigating the Self Service User Interface
- Dashboard Tab
- My Services Tab
- Setting a Retirement Date for a Service
- Retiring a Service
- Setting Ownership of a Service
- Adding and Editing Tags
- Removing a Service
- Editing a Service
- Controlling Virtual Machine Power States
- Creating Virtual Machine Snapshots
- Viewing Virtual Machine Snapshots
- Accessing the Virtual Machine Console
- Web Console (Cockpit) Integration
- My Orders Tab
- Service Catalog Tab
Self Service User Interface Guide
ManageIQ Self Service
ManageIQ Self Service is a web-based graphical user interface for ordering and managing IT service requests. You can enable self-service tenant end users, who can easily access their services, track requests, and manage their accounts using the Self Service user interface (SSUI), which has widgets, dashboard controls and feedback. The Self Service user interface supports role-based access control (RBAC) of menus and features, similar to in the full administrative user interface.
Note:
All catalog items, dialogs, buttons, icons among other items must be configured in the full administrative user interface before they are available to users in the Self Service user interface.
Accessing the Self Service User Interface
The Self Service user interface is running by default and does not need to be started or configured. To access the Self Service user interface, you must know the host name (or IP address) of the appliance, and the login credentials.
Self Service URL:
https://HOSTNAME/ui/service/
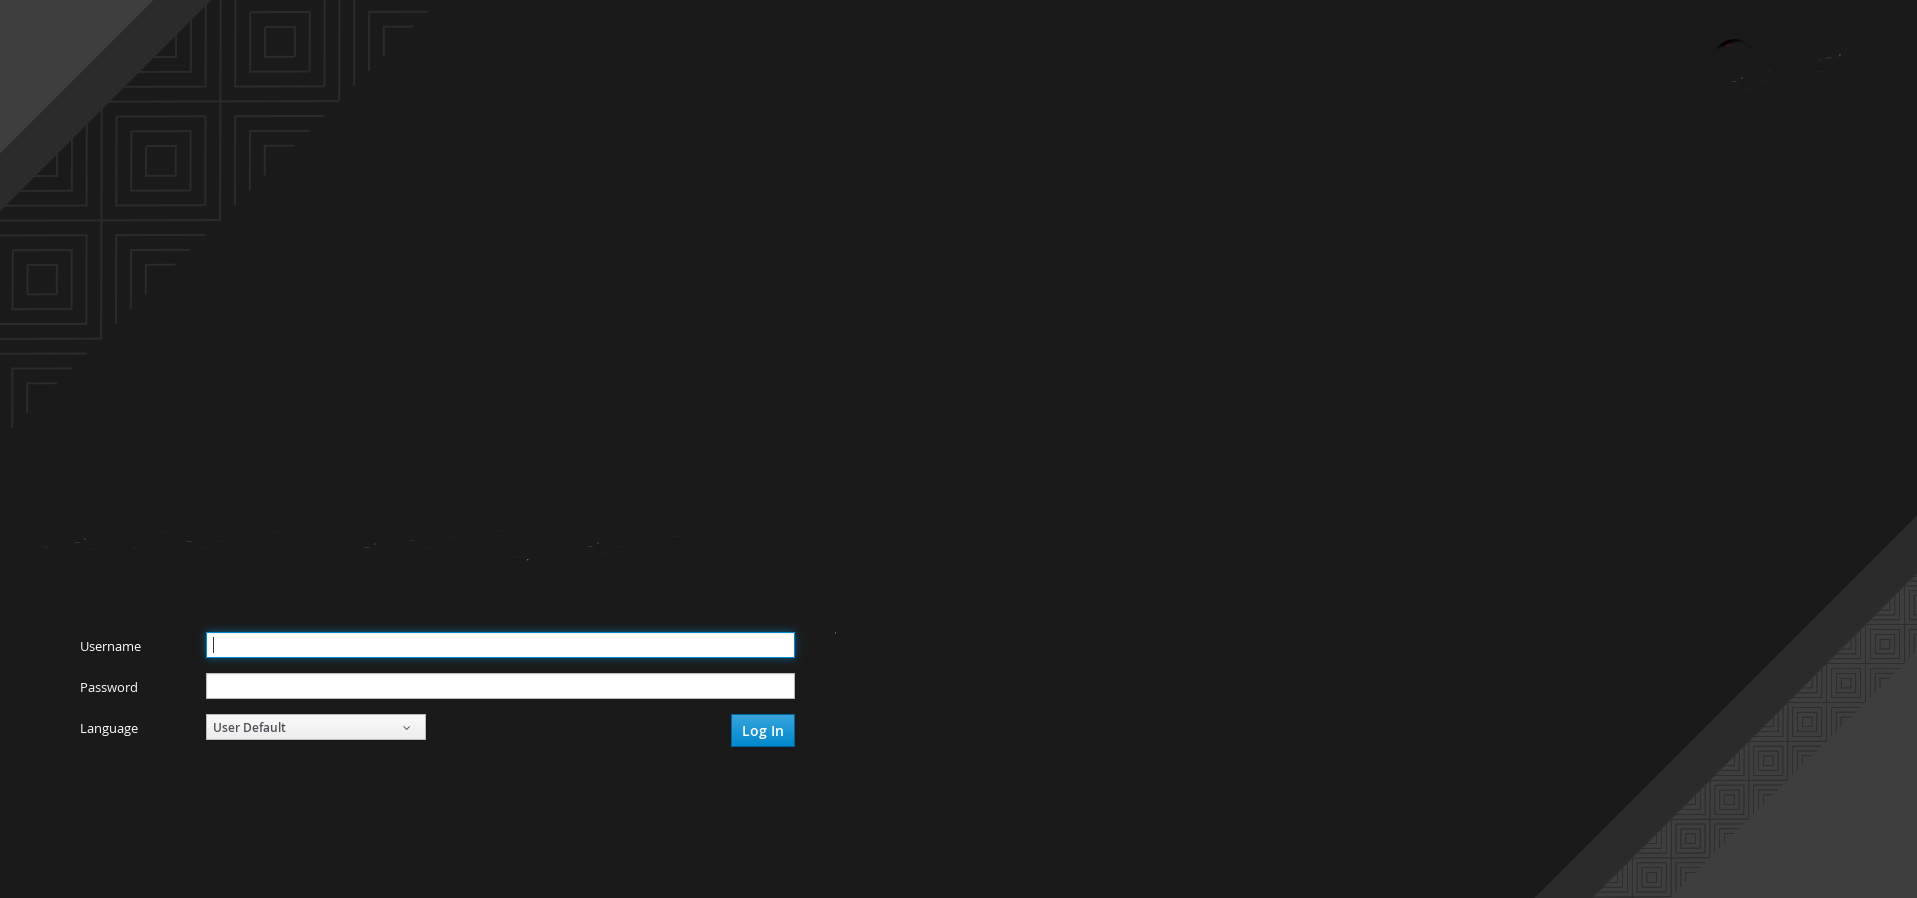
You can choose your preferred language for the Self Service user interface from the options in the Language list available on the login screen. The following languages are supported:
-
English
-
Español (Spanish)
-
Français (French)
-
日本語 (Japanese)
-
한국어 (Korean)
-
Nederlands (Dutch)
-
Português (Portuguese)
-
Português do Brasil (Brazilian Portuguese)
-
简体中文 (Simplified Chinese)
-
Traditional Chinese
Additionally, the User Default and Browser Default options default to the language already set by the user or browser respectively.
Navigating the Self Service User Interface
The Self Service user interface has a slideout navigation menu on the left that can be minimized by clicking the menu icon (≡), like in the full administrative user interface. The slideout navigation menu comprises of the following tabs:
-
Dashboard
-
My Services
-
My Orders
-
Service Catalogs
The menu bar that runs along the top of the user interface contains several options including a shopping cart, notifications feature, full administrative user interface option, and a help option. Besides that, you can see the current logged in LDAP user, for example, Administrator.
-
Shopping Cart Click the shopping cart icon to view services that are available to order, manage your cart as required, and order all services at one time. You can read more about the shopping cart model adopted in the Self Service user interface under ???.
-
Notifications The Self Service user interface has introduced a new notifications feature that displays messages generated by the system for various events, such adding services to the shopping cart, ordering services, provisioning, service power operations, and so on. Click the bell icon to open or close the Notifications drawer, which shows various notification events. You can click the double arrows (
 ) located on the upper-left of the Notifications drawer to expand or contract the size of the Notifications screen as required.
 -
Administration User Interface Link Clicking the menu icon (
 ) shows the Administration UI link, which when clicked, takes you to the full administrative user interface login page in a new window or tab of your web browser.
 -
Help Click the help icon to access the options to open Documentation, Red Hat Customer Portal, and About. Click About to see information about your Self Service environment, such as the logged in user name and role, the browser details, and importantly, the Self Service user interface version number, which can be useful for support purposes.
Note:
The resources linked to in the help icon will be, by default, the ones listed above. System administrators can change them to other resources as required for the logged in user.
-
Role-Based Access Control The Self Service user interface supports role-based access control of menus and features. If you are a member of multiple user groups, you can change the acting group by navigating to Administrator > Change Group, then select the new group from the available options in the list.
-
Switch Language Although you can set your preferred language for the user interface from the login screen itself, you can switch to a different language than what is currently set also by navigating to Administrator > Switch Language within the Self Service user interface.
Dashboard Tab
Once you log in to the Self Service user interface, you will see the dashboard screen by default. The Dashboard tab provides a quick summary of the services available, requests made, and their statuses as below:
-
Total Services
-
Current Services
-
Services Retiring Soon
-
Retired Services
-
Total Requests
-
Pending Requests
-
Approved Requests
-
Denied Requests
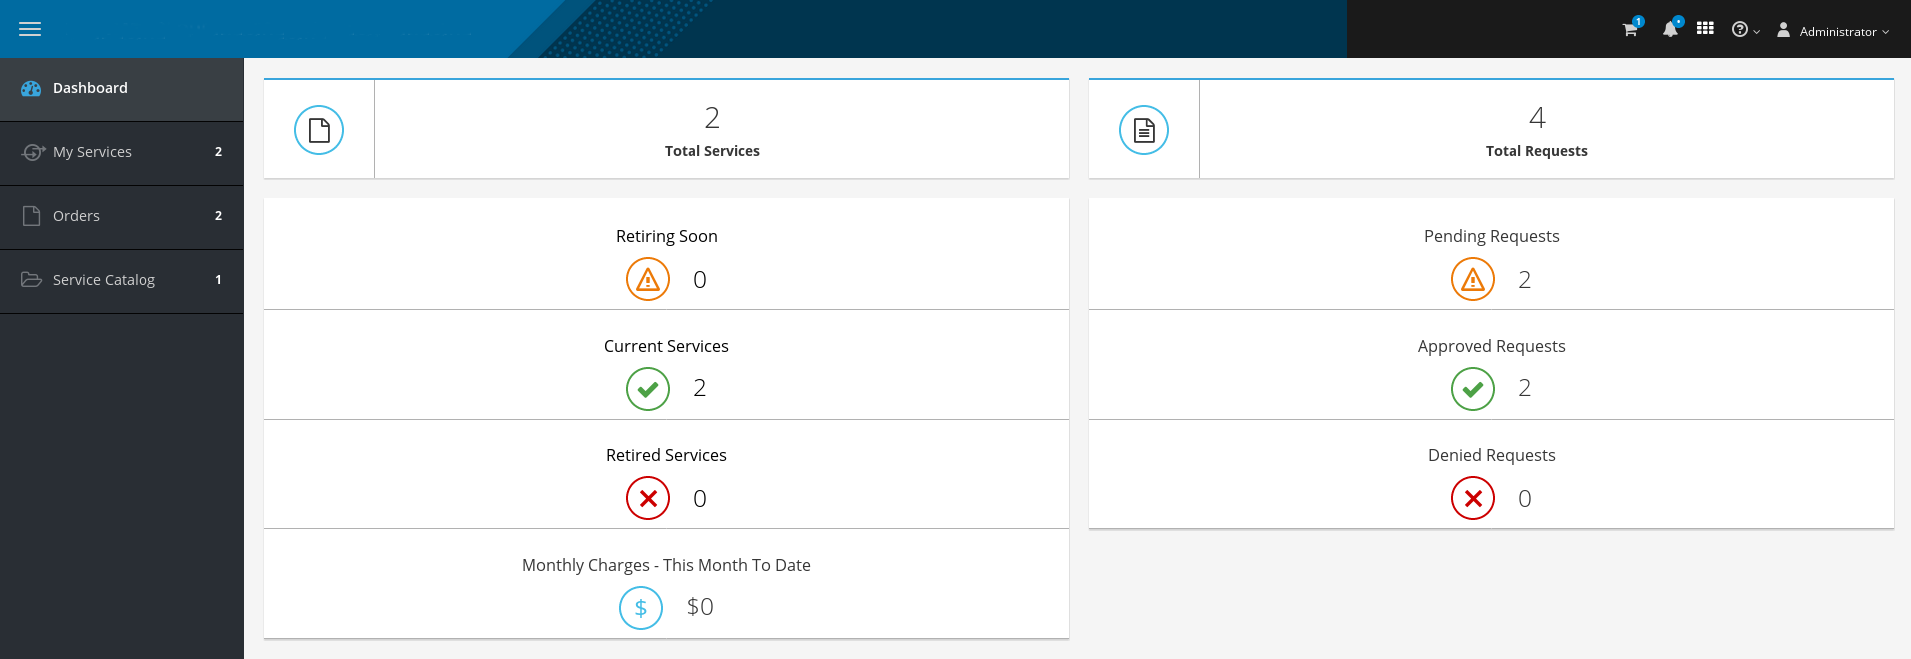
- Monthly Charges - This Month To Date The Self Service user interface has added basic support for displaying monthly chargeback data of the computing and storage cost for the use of resources, in the currencies supported by the full administrative user interface. This provides a quick summary of where you are from cost standpoint to that point in the month. For more information about configuring chargeback rates in the full administrative user interface and how ManageIQ calculates chargeback costs, see Chargeback in the Monitoring, Alerts, and Reporting guide.
Note:
If you are on the first day of the month, there can be no data yet therefore resulting in zero dollar amount. Also, if you have a lot of data, it might not have rolled into the new month yet, resulting in no data and dollar amount for month to date.
My Services Tab
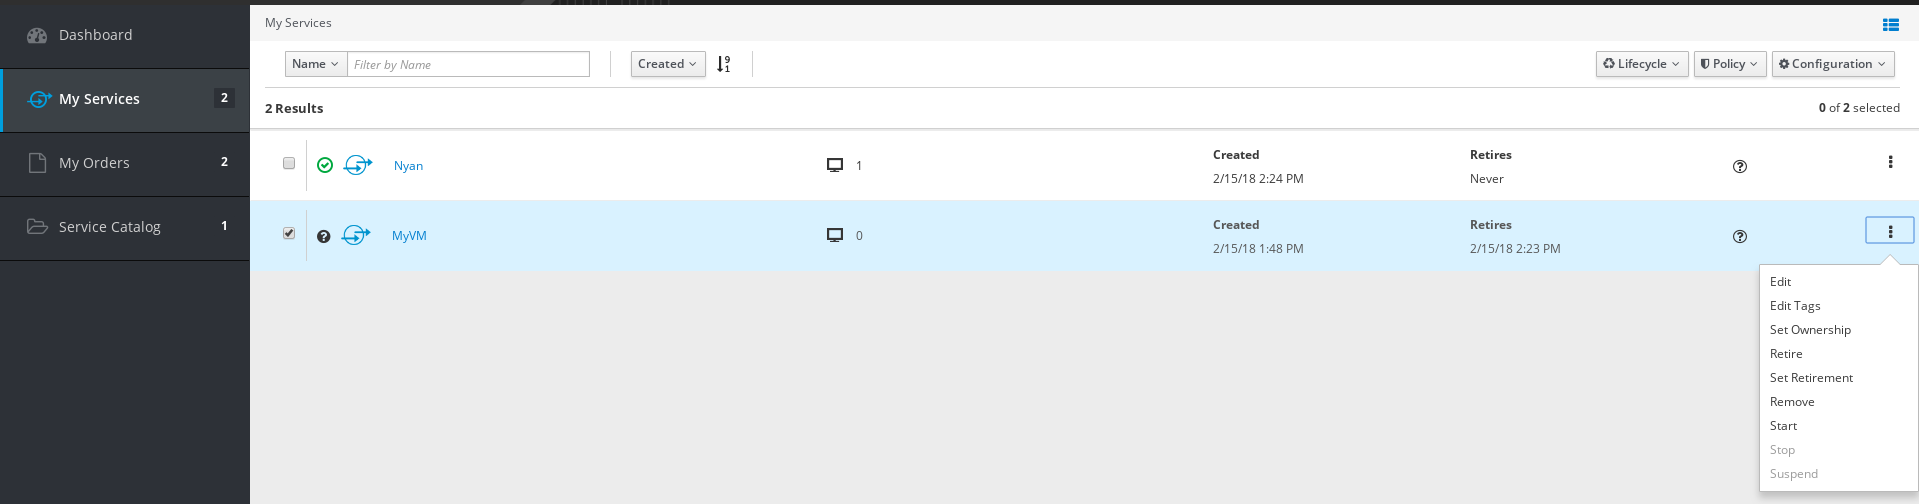
The My Services tab lists all service requests individually with a summary of information associated with each service, including the Service Name, its current Power State represented by an icon, Number of VMs, Owner, date Created, and Retires date. Additionally, you can see the chargeback cost per service for a virtual machine’s month-to-date usage. You can filter or sort services by those entities, and by Relative Cost.
On the same screen, you have the option to edit the service name and description, edit tags, set ownership, retire the service now or at a later date, or remove the service by clicking more options (represented by three dots) next to the service. You also have options to perform power operations, that is start, stop, or suspend, at the service level. You can choose to click on a service where you can perform all of these actions at the service level using the designated buttons located at the top of the screen, as well as access the virtual machine dashboard, manage snapshots, and open the virtual machine and web console from under the Resources section. You can also control power operations and life cycle of virtual machine resources via more options (represented by three dots).
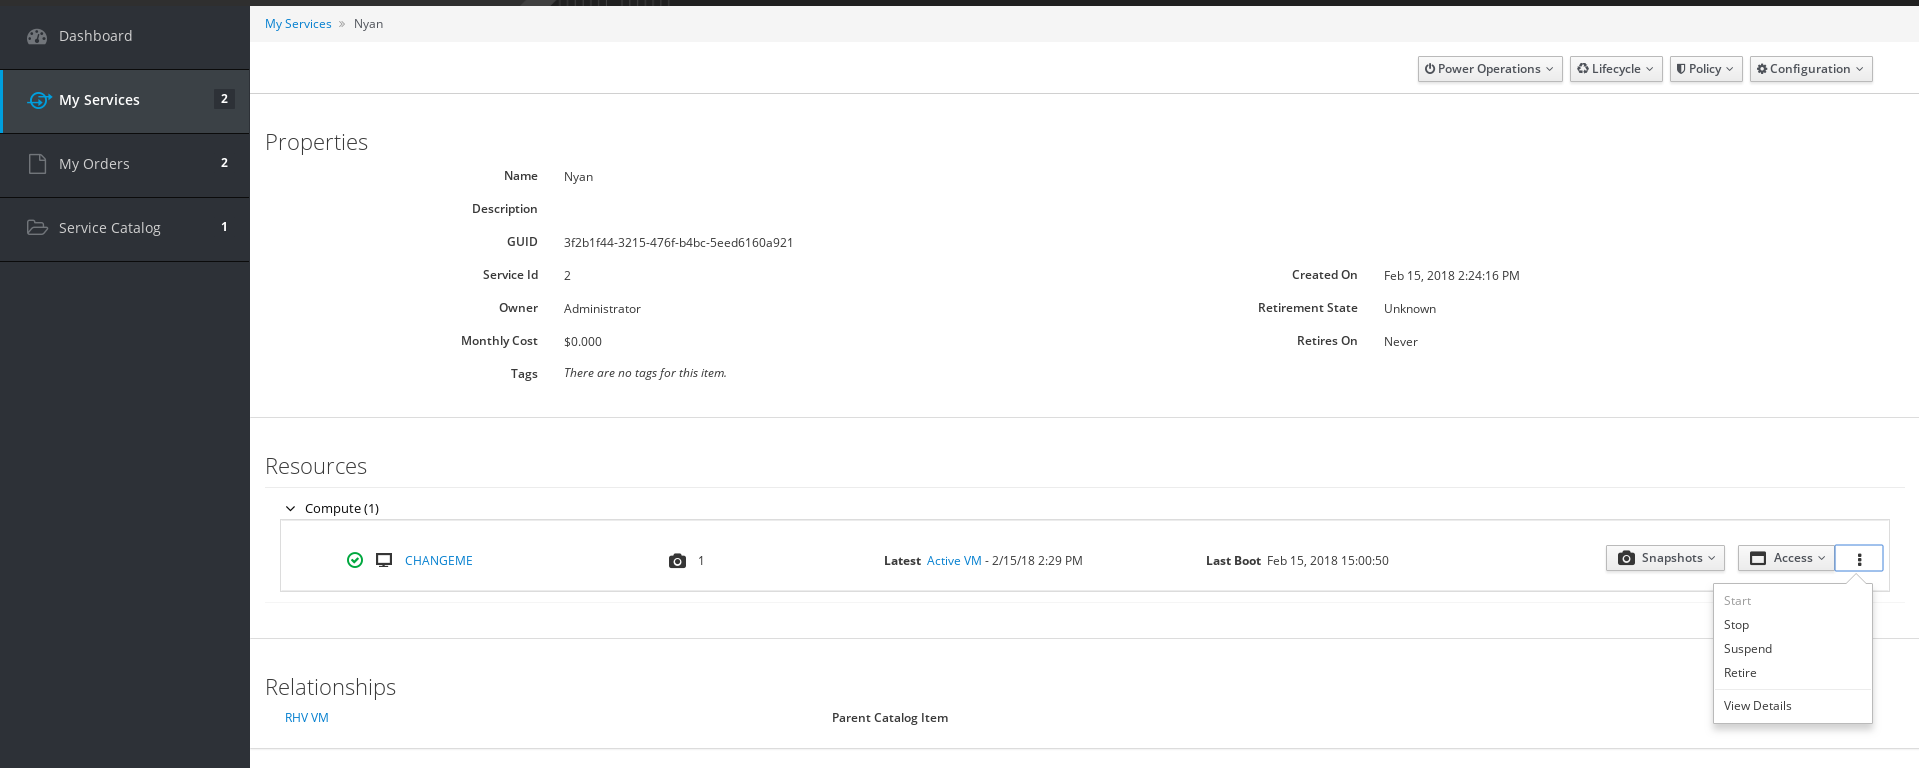
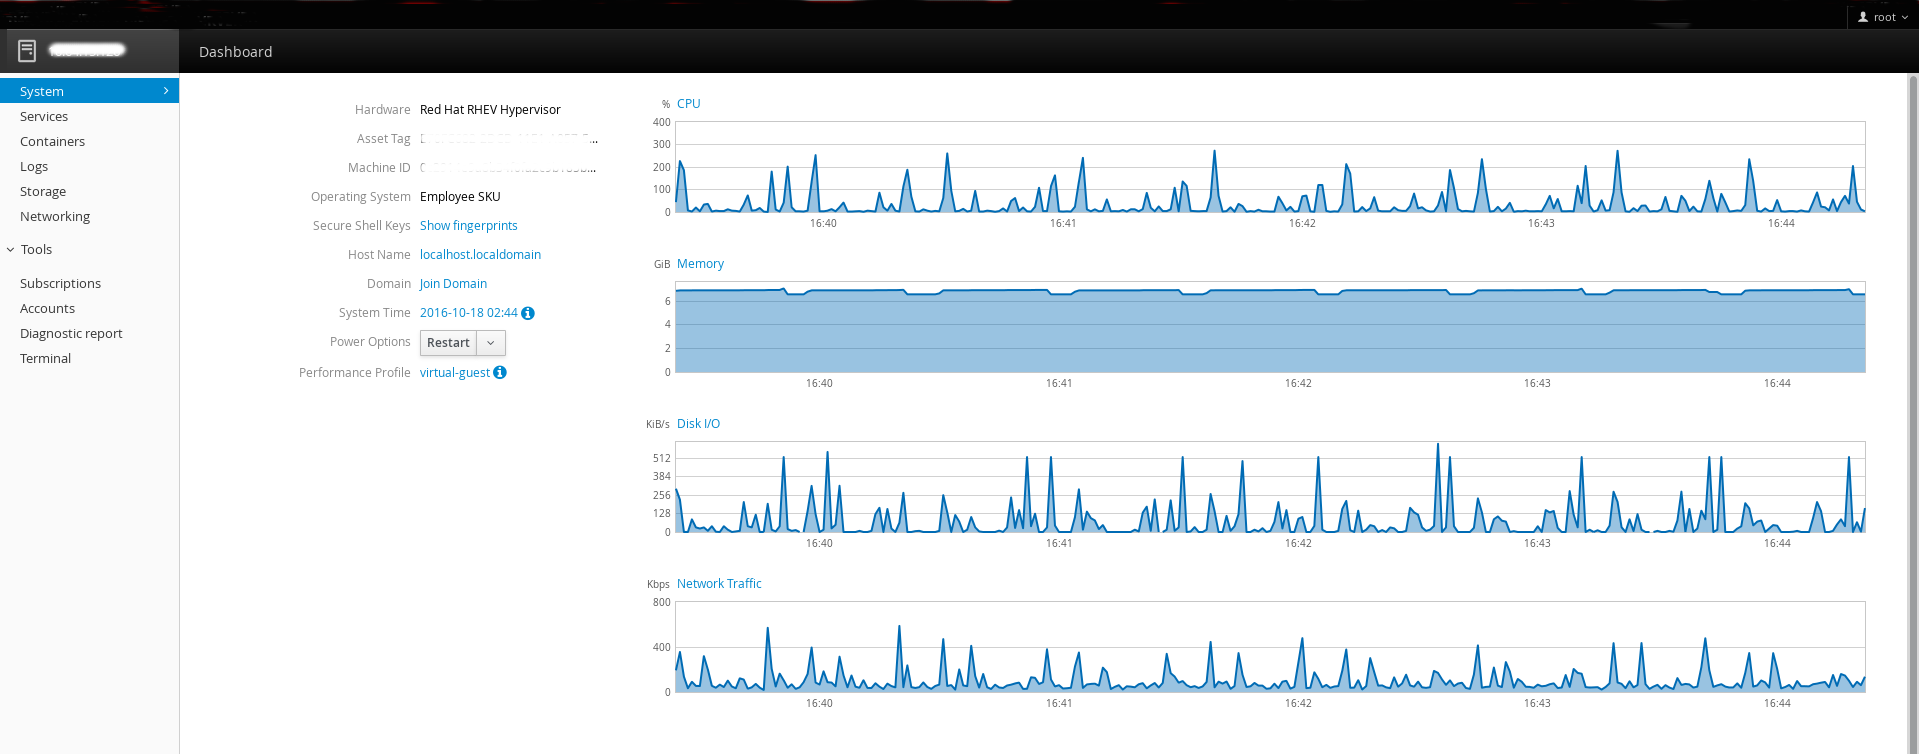
Virtual Machine Dashboard:.
From the My Services screen, click on a service and then on the virtual machine name or View Details under more options (represented by three dots) to access the virtual machine dashboard. The dashboard displays the following information about the virtual machine resource:
-
Compliance
-
Retirement
-
Snapshots
-
Timeline of power events
-
Utilization of CPU, Memory, and Storage
-
Smart State analysis
-
Tags
-
Custom attributes
-
Disk usage
Additionally, you can also control the virtual machine power operations, and manage snapshots from the dashboard. A snapshot is a copy of the virtual machine’s disk file (VMDK) that captures the entire state of the virtual machine at a point in time.
Setting a Retirement Date for a Service
Follow this procedure to schedule retirement for a service at a later date. For retiring a service immediately, see Retiring a Service.
-
From the Services screen, click on the required service you want to schedule retirement for.
-
Click the
 button located on the
upper-right corner of the screen, then select Set Retirement Dates. The Schedule Service Retirement window will appear.
button located on the
upper-right corner of the screen, then select Set Retirement Dates. The Schedule Service Retirement window will appear. 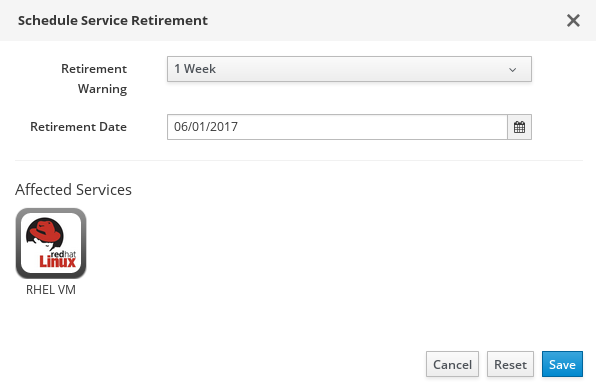
-
Set the Retirement Date.
-
Select the Retirement Warning from the list.
-
Click Save.
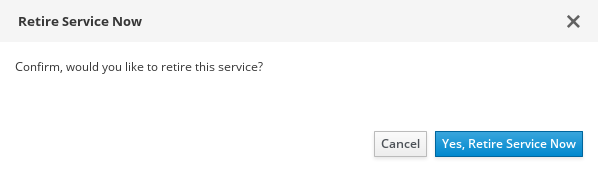
Retiring a Service
Follow this procedure to retire a service immediately. For retiring a service at a later date, see Setting a Retirement Date for a Service.
-
From the Services screen, click on the service you want to retire now.
-
Click the
button located on the
upper right corner of the screen, then select Retire. The Retire Service Now window will appear to confirm your action.
-
Click Yes, Retire Service Now.
Setting Ownership of a Service
Follow this procedure to set ownership of a service.
-
From the Services screen, click on the more options button next to the service you want set ownership for, then click Set Ownership. Alternatively, click on the service. Click the
 button located on the upper-right corner of the screen, then select Set Ownership.
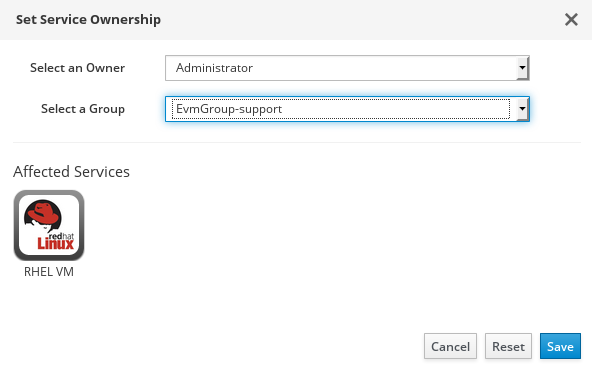
-
Select an owner from the list.
-
Select a group from the list.
-
Click Save.
Adding and Editing Tags
Follow this procedure to add or edit tags for a service.
-
From the Services screen, click on more options next to the service you want add or edit tags for, then click Edit Tags. Alternatively, click on the service. Click the
 button located on the
upper-right corner of the screen, then select Edit Tags.
button located on the
upper-right corner of the screen, then select Edit Tags. 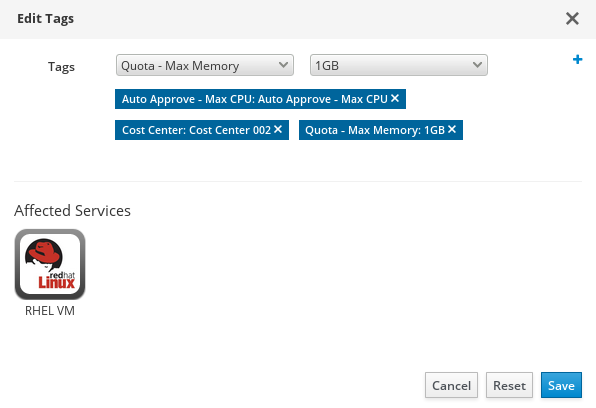
-
To add a tag, select the tag category and value from the lists, then click the blue plus (+) sign as shown in the screen capture.
-
To edit tags, simply change the value assigned to a category, or click on the cross sign in the tag to delete an existing tag.
-
Click Save.
Removing a Service
Follow this procedure to remove a service.
-
From the Services screen, click on more options next to the service you want to remove, then click Remove. Alternatively, click on the service. Click the
button located on the upper-right corner of the screen, then select Remove. A confirmation window appears. -
Click Yes, Remove Service.
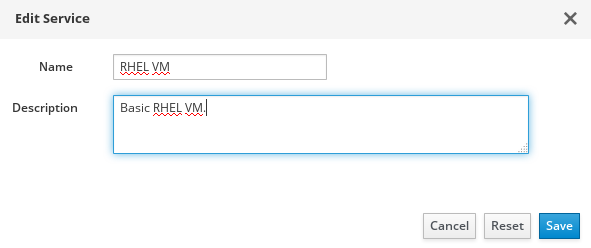
Editing a Service
Follow this procedure to edit the name and description of a service.
-
From the My Services screen, click on more options next to the service you want to edit, then click Edit. Alternatively, click on the service. Click the
button located on the upper-right corner of the screen, then select Edit. An Edit Service screen appears. -
Edit the name and description of the service as required.
-
Click Save.
Controlling Virtual Machine Power States
Follow this procedure to perform power operations on virtual machines, such as start, stop, or suspend, depending on the current state of the virtual machine.
-
From the My Services screen, click on the required service.
-
Under Resources, click more options (represented by three dots) where you have the option to start, stop, or suspend the virtual machine. Alternatively, click on the virtual machine name to see more details about the resource, including the Power Operations button.
Creating Virtual Machine Snapshots
To create a snapshot from the Services screen:
-
From the My Services screen, click on the service associated with the virtual machine you want to create a snapshot for.
-
In Resources, click Snapshots next to the virtual machine you want to create a snapshot for, then select Create to create a snapshot. The Create Snapshot window appears.
-
Enter a name for the snapshot.
-
Optional: Select Memory if you want to capture the state of the virtual machine’s memory.
-
Optional: Enter a Description.
-
Click Create.
To create a snapshot from the Resources screen:
-
From the My Services screen, click on the service associated with the virtual machine you want to create a snapshot for.
-
In Resources, click on the virtual machine you want to create a snapshot for.
-
On the virtual machine dashboard, click the Snapshots button, then select Create. The Create Snapshot window appears.
-
Enter a name for the snapshot.
-
Optional: Select Memory if you want to capture the state of the virtual machine’s memory.
-
Optional: Enter a Description.
-
Click Create.
Viewing Virtual Machine Snapshots
-
From the My Services screen, click on the service associated with the virtual machine you want to view snapshots for.
-
In Resources, click Snapshots next to the virtual machine and select View to view available snapshots. Alternatively, click on the virtual machine, then click Snapshots to view available snapshots.
Note:
You can revert or delete a snapshot only from the snapshot summary screen. To do so, navigate to Snapshots > View, click more options (represented by three dots) next to the snapshot you want to revert or delete, and then click Revert or Delete as required. Revert returns a virtual machine to a previous state when you took the snapshot.
Accessing the Virtual Machine Console
Follow this procedure to open a console window to the virtual machine. The console is the remote control system that enables you to interact directly with your virtual machines.
-
From the Services screen, click on the required service.
-
In Resources, click the
 button next to the virtual
machine and select VM Console.
button next to the virtual
machine and select VM Console.
The virtual machine console will open in a new window of your web browser. Note that you may have to enable the pop-up settings in your browser to access the console.
Web Console (Cockpit) Integration
The Web console (Cockpit) is an interactive Linux server administrative interface. You can perform simple administration tasks such as starting containers, storage administration, network configuration, and inspecting logs. While Cockpit allows you to monitor and administer several servers at the same time, your browser connects to a primary server that runs the Cockpit web service through which connections to additional servers can be established.
The ManageIQ full administrative user interface and the Self Service user interface have enabled for users to access the Web console (Cockpit interface) for a given virtual machine.
Accessing the Web Console
Note:
Launching of Cockpit requires as IP address for the virtual machine. It must be pre-configured and running on the virtual machine.
You can open the Web console (Cockpit) for a virtual machine from the button.
-
From the My Services screen, click on the service associated with the virtual machine you want to open the Web console for.
-
In Resources, click Access next to the virtual machine and select Web Console. A notification will appear to show the Cockpit interface is loading.
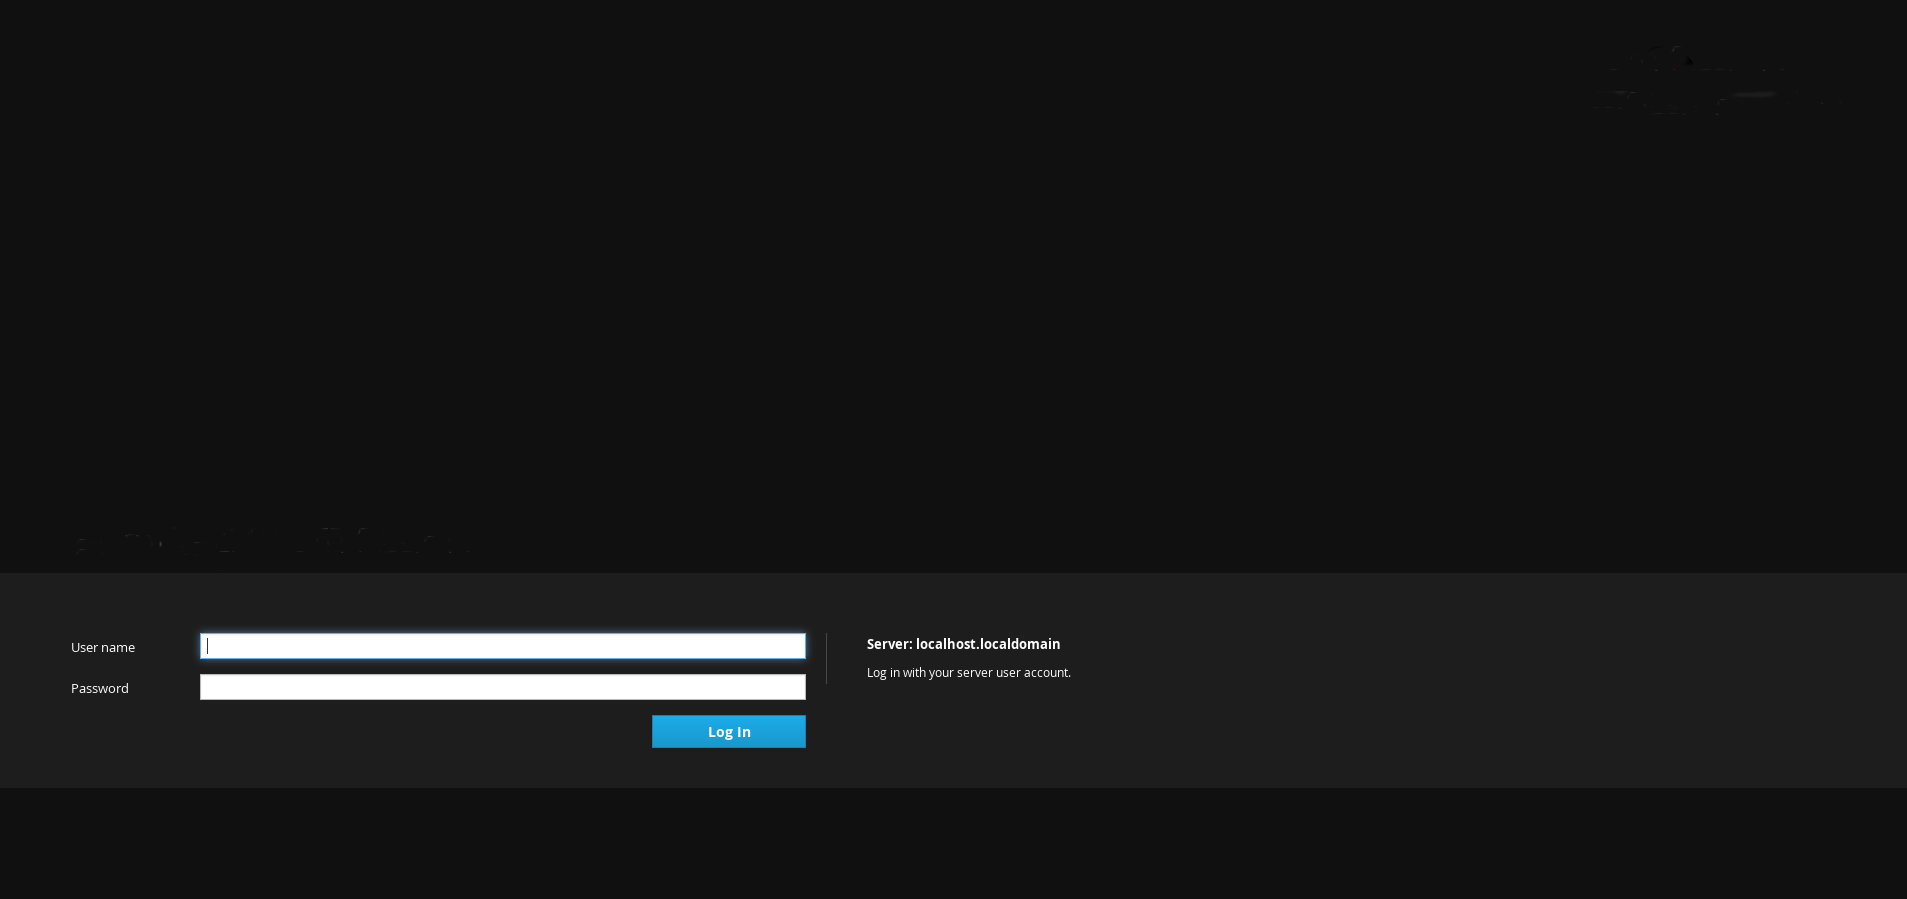
-
The Cockpit interface for the virtual machine will open in a new browser window. If you get a security warning by the browser, you will need to add this connection to the security exceptions. Click Advanced → Add Exception → Confirm Security Exception. After that, you will see the login screen.
-
Once you have logged in, you will see the tabs for the dashboard and the individual machines added to Cockpit.
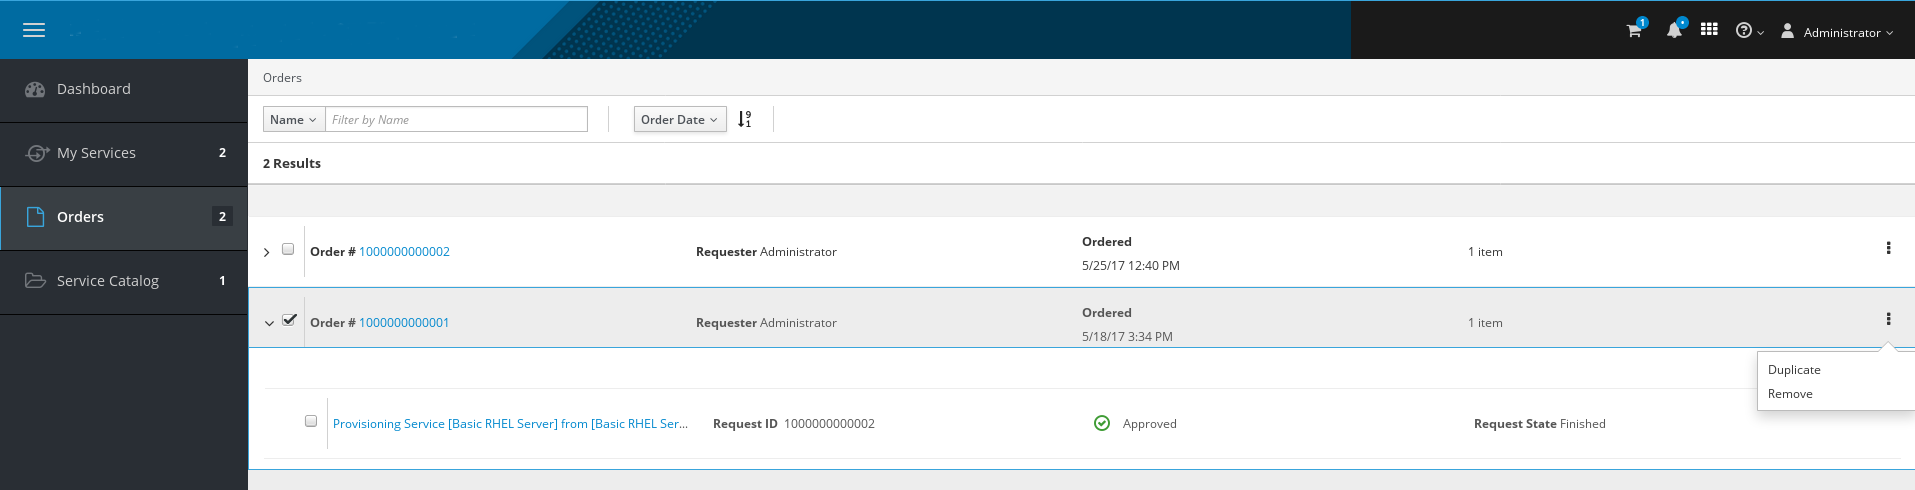
My Orders Tab
The My Orders tab lists all shopping cart orders which contain service requests added from the Service Catalog.
Click on the tab to see a summary of each order, including the order number, requester, order date, and the number of items. Click the arrow next to an order number to see more details such as the requests associated with the order, request ID, whether it is approved or denied, and the current state of the request. You can reorder a request by clicking the Reorder button, then enter the options associated with the order, and add to shopping cart. You can click on more options (represented by three dots) next to an order to Remove the order.
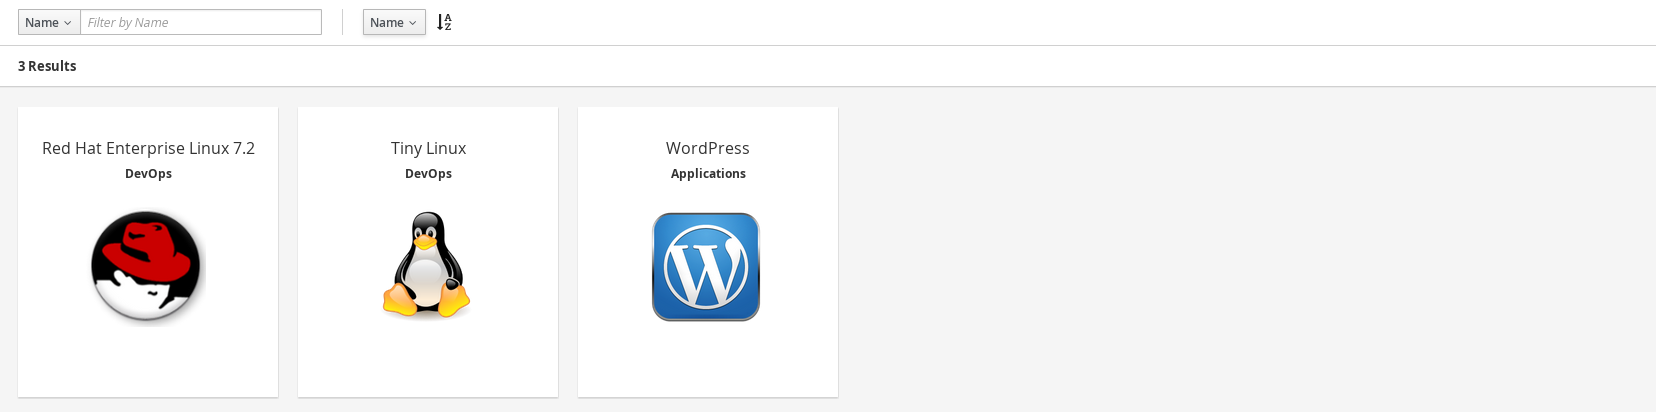
Service Catalog Tab
The Service Catalog tab lists all service catalog items, displayed as tiles. These items must be configured on the administrative user interface before they will be accessible to the user here. You can filter or sort the service catalog items by Name, Description and Catalog Name.
Click on a service to go to the page where you can enter the requested information in the dialog fields under Service and VM Name and VM Characteristics associated with the service. Note that there is now an ability to add dynamic dialog elements within the Self Service user interface, meaning you can include a particular dialog field where ManageIQ will communicate to the instance and method, obtain the required information, and enter the value in the field dynamically. After you have entered all information in the dialog fields, click Add to Shopping Cart.
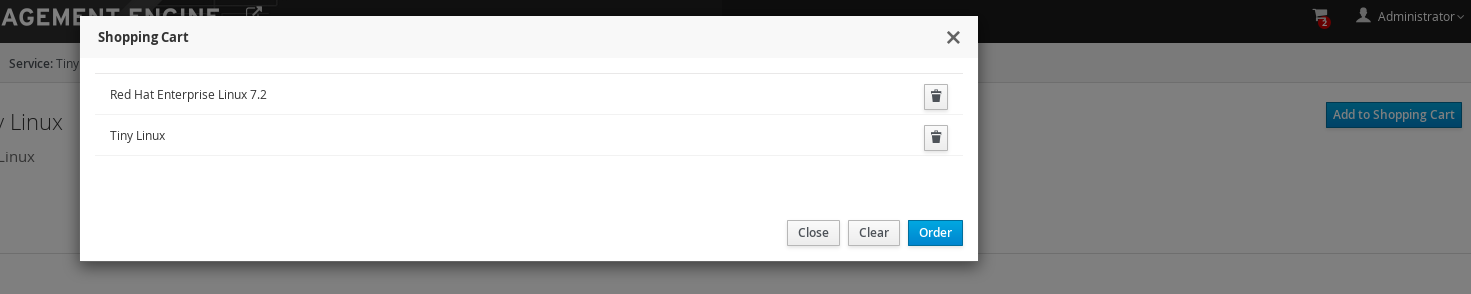
Shopping Cart:
The Self Service user interface has adopted a shopping cart model for ordering services, instead of ordering them individually. Click on the shopping cart icon at the top to view all services added to the shopping cart that are available to order. You can delete a particular service from the cart if required, and order the services in the cart all at one time. Or, you can even choose to clear all the services in the cart and exit.
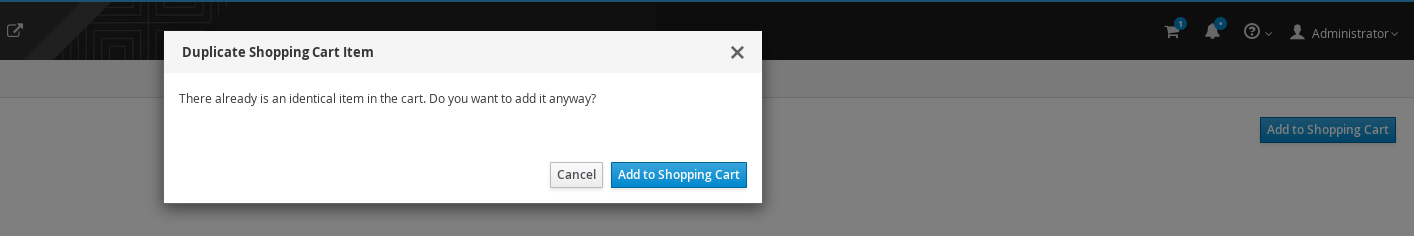
If you click Add to Shopping Cart for the same item, you will see a pop up window alerting you that there is an identical item in the cart but if you want to add it anyway.